|
||||||||||||||||||||||||
|
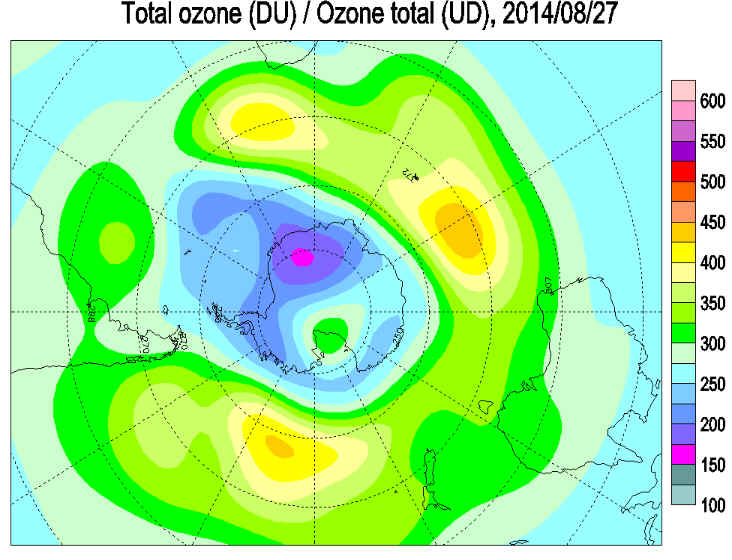
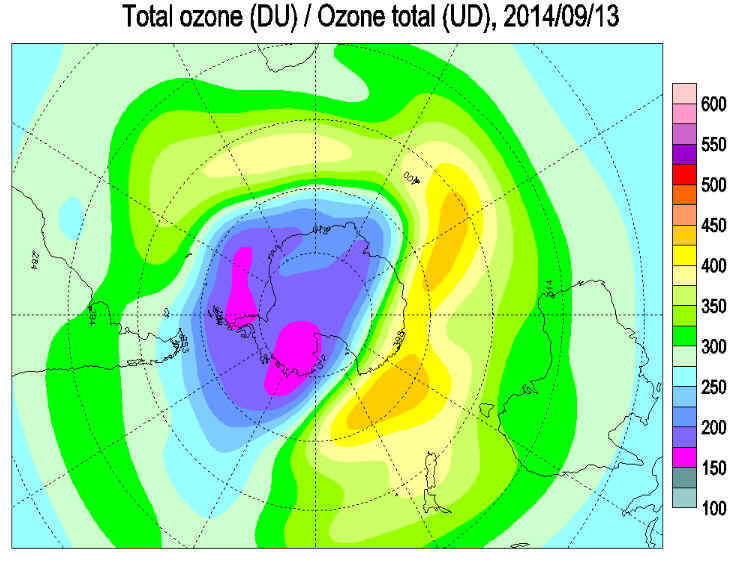
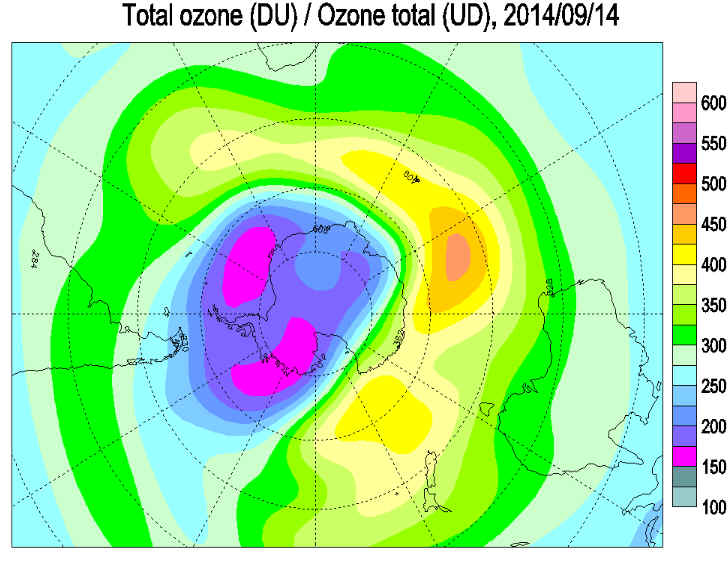
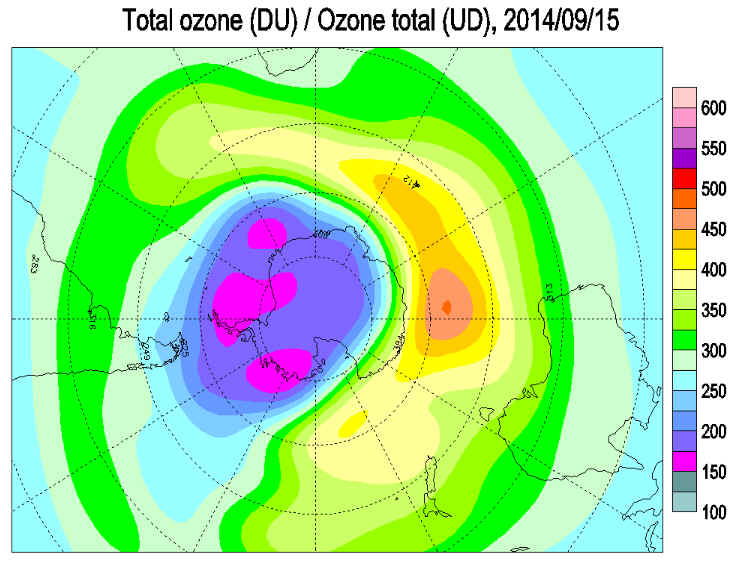
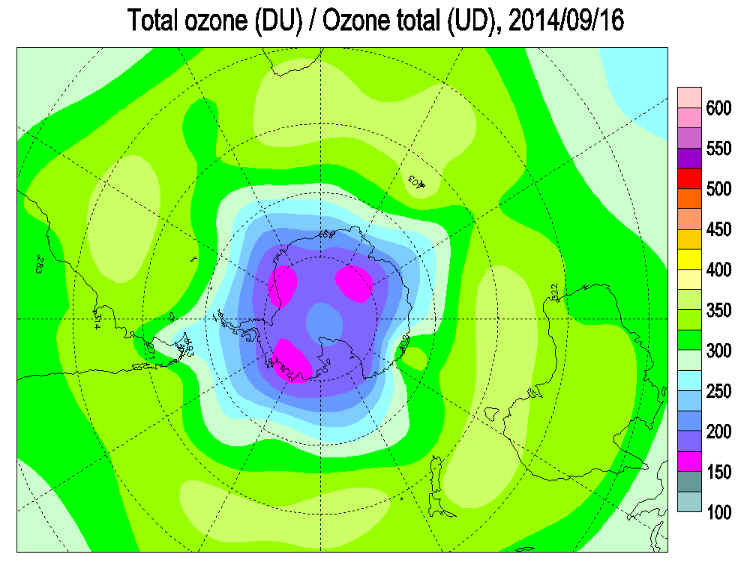
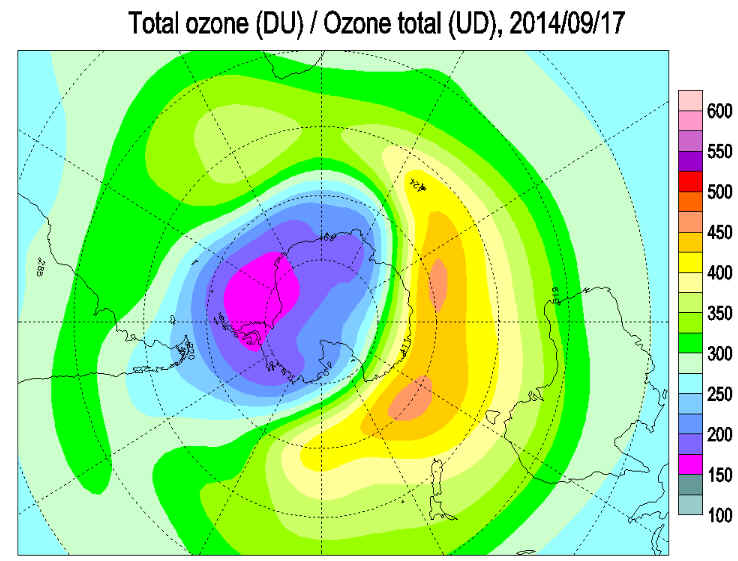
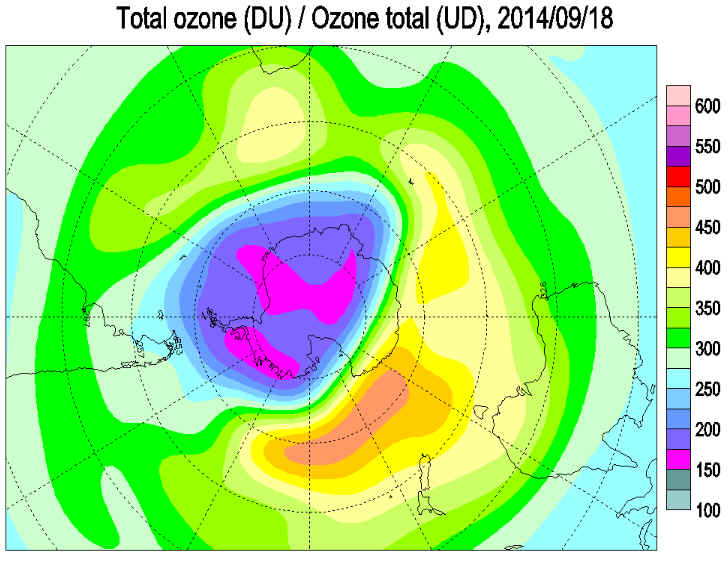
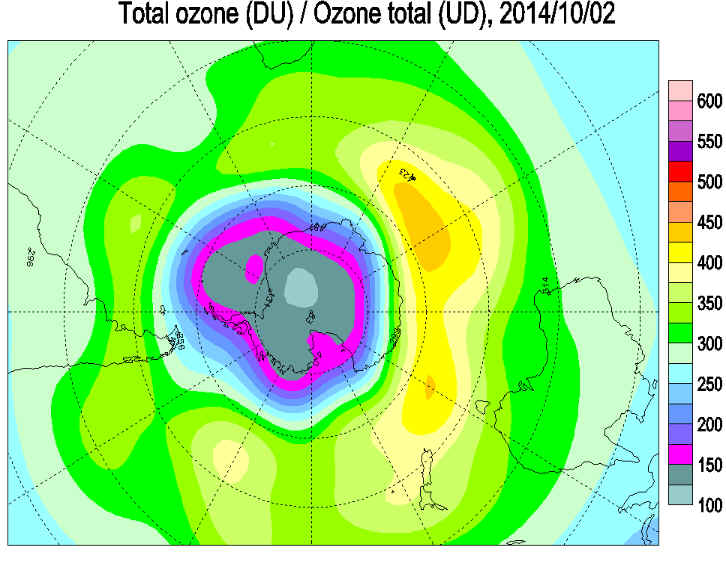
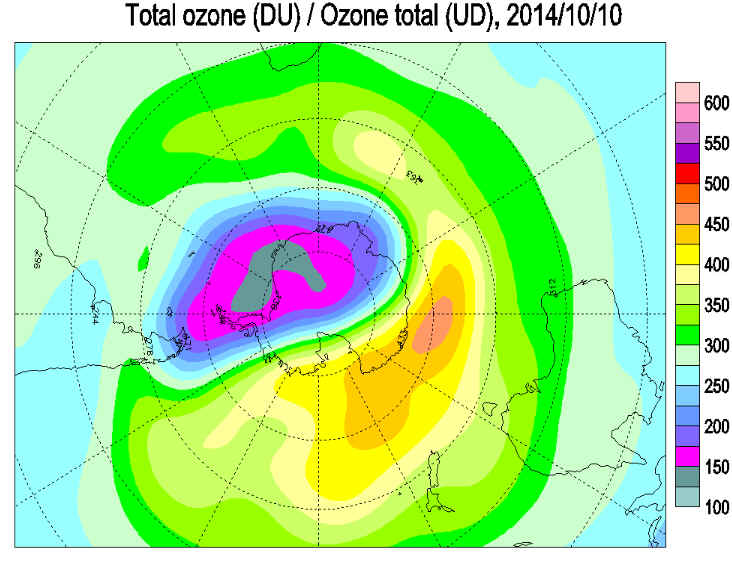
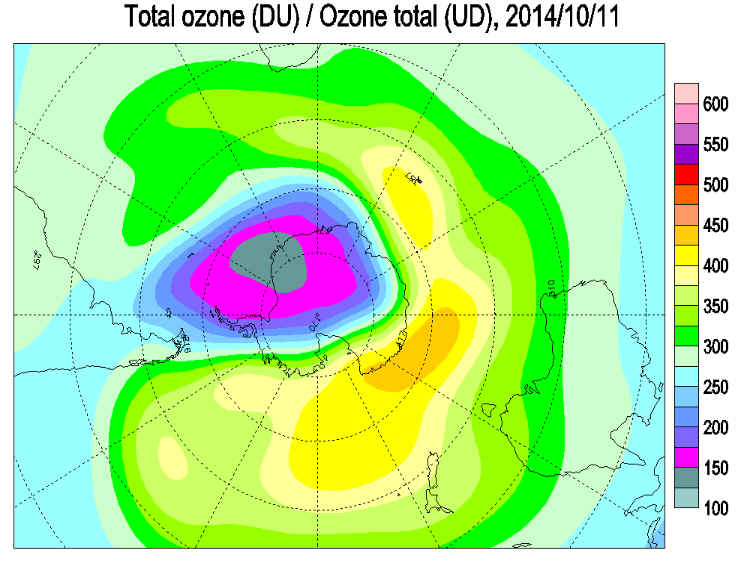
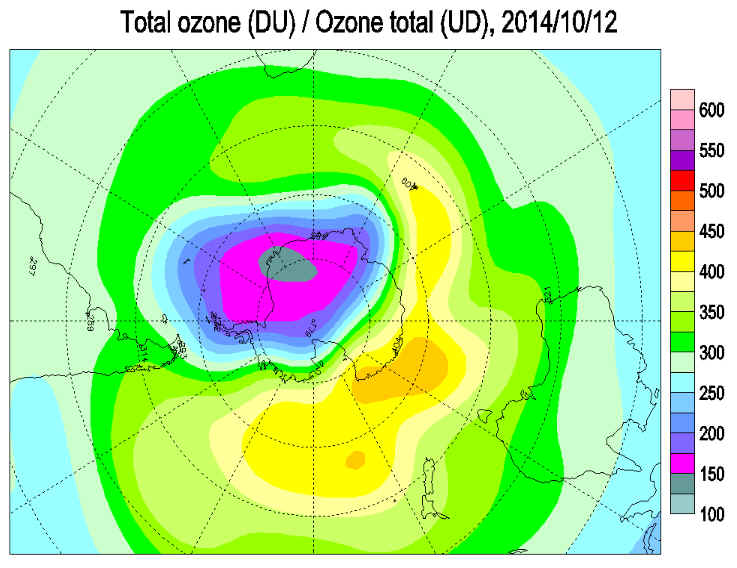
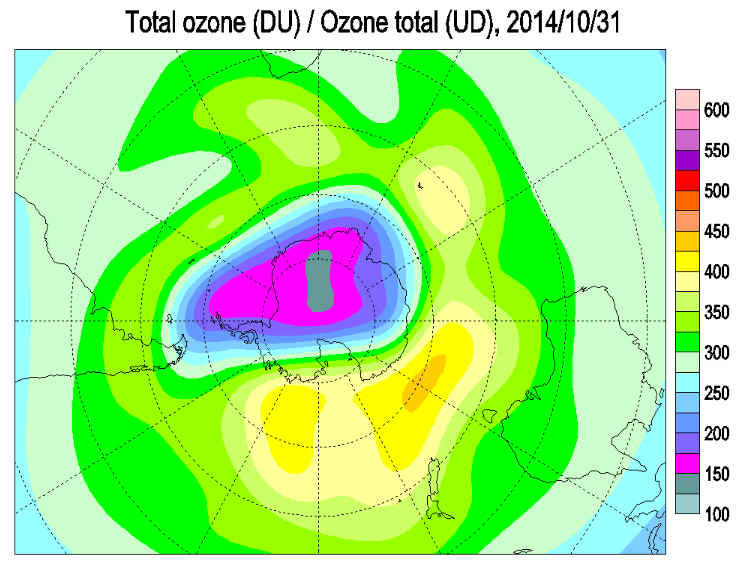
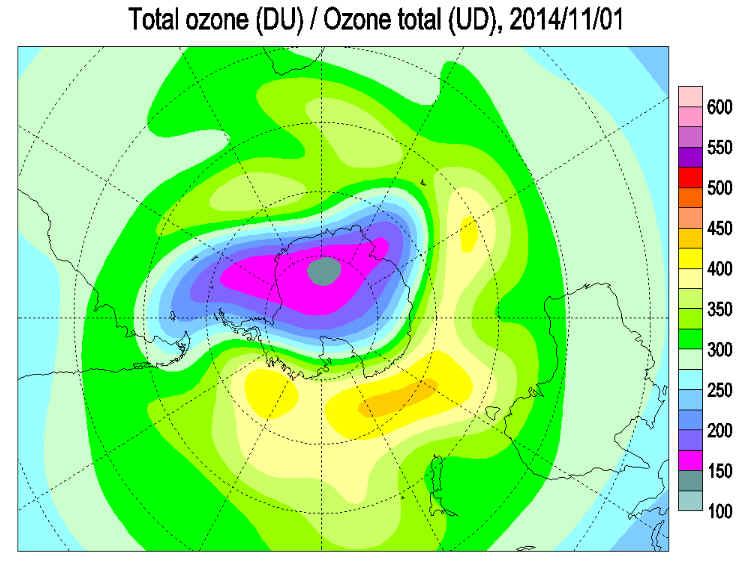
The Ozone Hole Reaches South America 2014
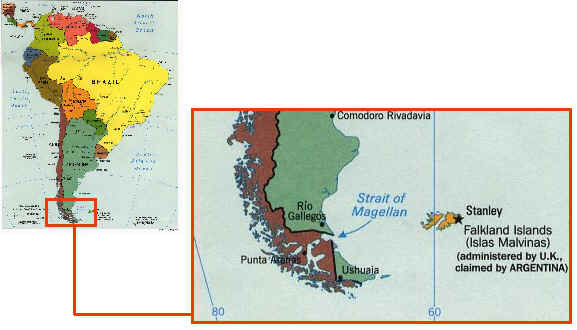
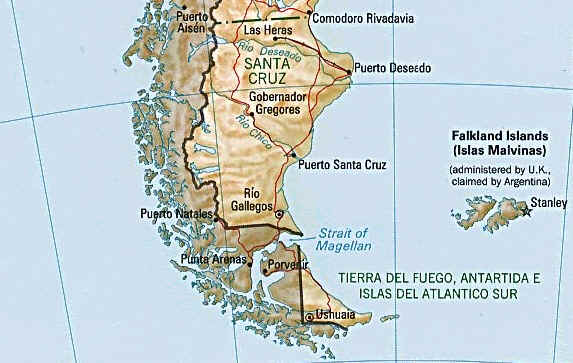
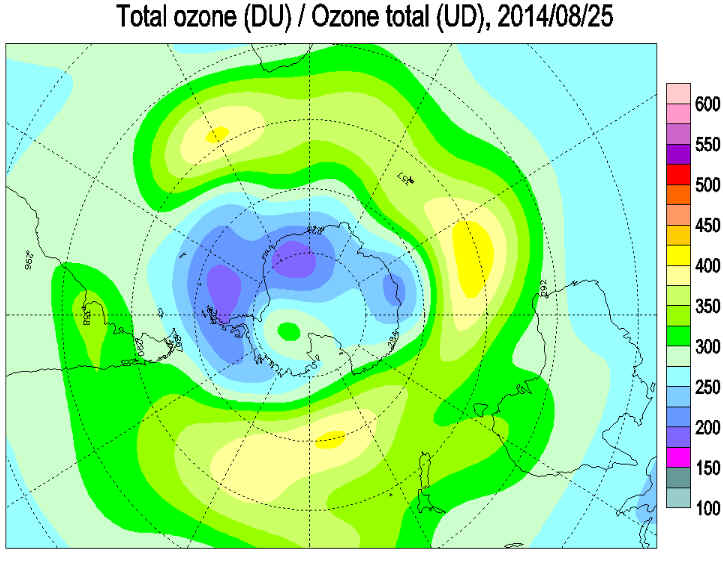
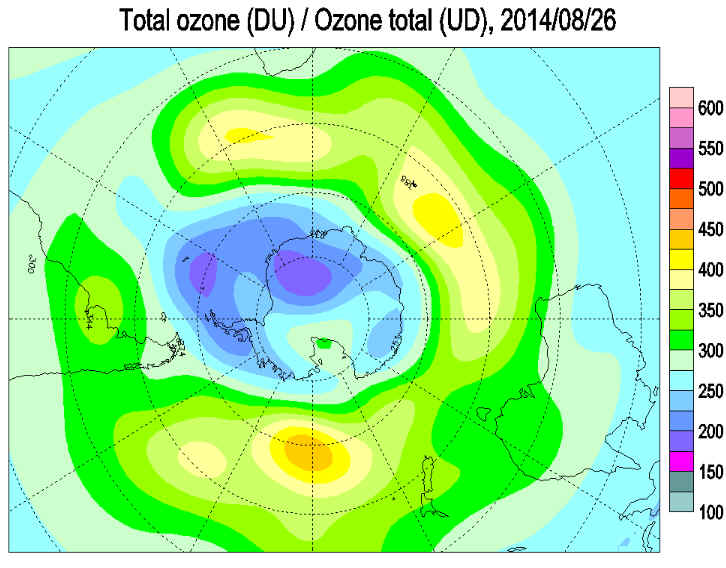
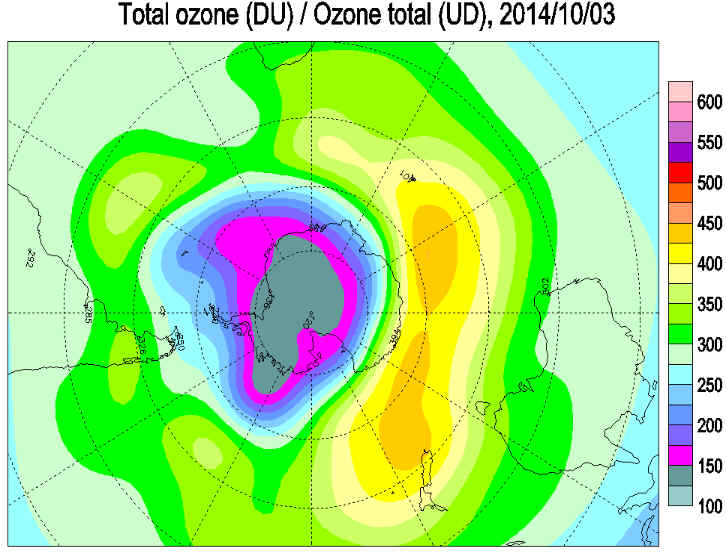
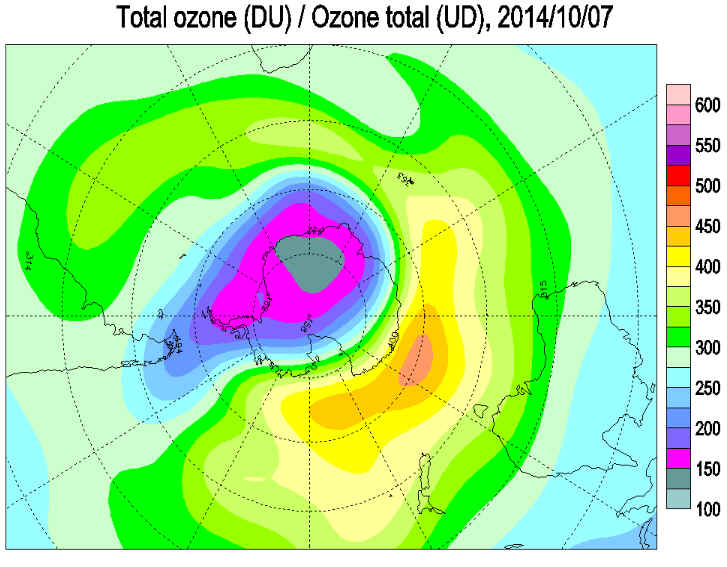
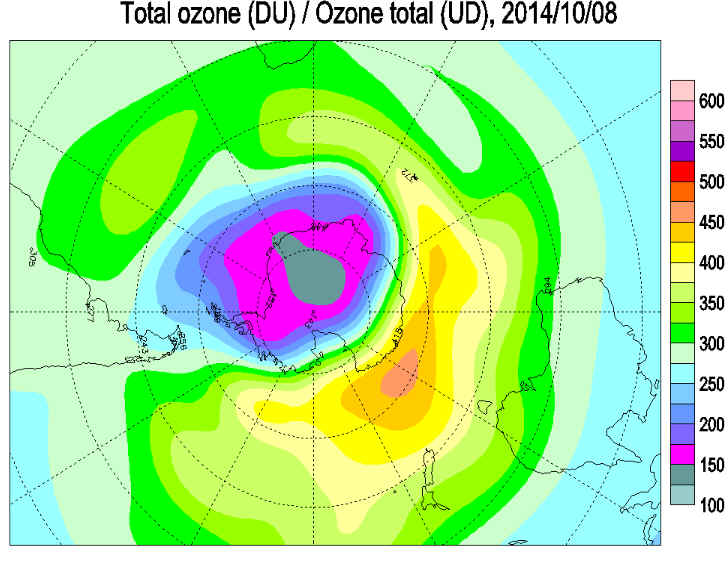
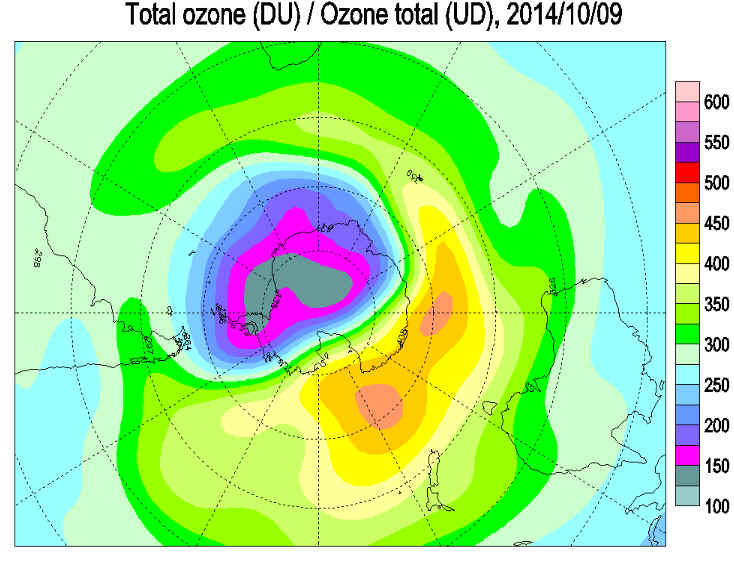
The edge of the ozone hole covered the southern tip of South America from September 13 to 18, the southern tip of South America, the Falkland Islands and South Georgia from October 7 to 15 and South Georgia on August 25 to 27, October 3, 4, 31, November 1. The Ozone hole has reached land and population areas in Argentina, Chile and The Falkland Islands since the 1990's. Ozone levels drop down as much as 70% in some areas. The protective level of ozone has dropped below 150 dobson units in some areas. Punta Arenas is the only city in Chile where the media provide a daily report on ultraviolet radiation levels. When there is a yellow alert, there is a moderate level of UV radiation, but an orange or red alert means dangerous levels. The residents of Punta Arenas, despite receiving more unfiltered solar radiation, are less affected because they do not expose as much skin to the Sun's rays. The region's cold temperatures mean that people are less likely to be found outside with bare heads or arms. Another element in their favor is the location of the city with respect to the Sun. In Punta Arenas, solar radiation reaches the Earth's surface at a much more acute angle - and is therefore less intense - than in Santiago, located 2,200 km to the north. Chile has various ozone level measuring stations, Institutions like the Meteorological Administration and the Universities of Chile and Magellan, carry out permanent exploration on the state of the ozone layer.
Central Intelligence Agency Maps from University of Texas Map Cent
Maps of deviations represent total ozone deviations from the 1978-1988 level estimated using Total Ozone Mapping Spectrometer (TOMS) data for all areas except the Antarctic and from the pre-1980 level estimated using Dobson data over the Antarctic. Over areas with poor data coverage adjustments are made according to TOMS on Nimbus-7, Meteor-3, ADEOS and Earth Probe satellites. Over the polar night area Dobson and Brewer moon observations and/or NOAA's TIROS Operational Vertical Sounder (TOVS) satellite data are used. TOVS data are also used when the more reliable TOMS data are not available. The mapping algorithm is similar to those used by the WMO Ozone Mapping Centre. Credit:
|