|
Ozone Hole 2002

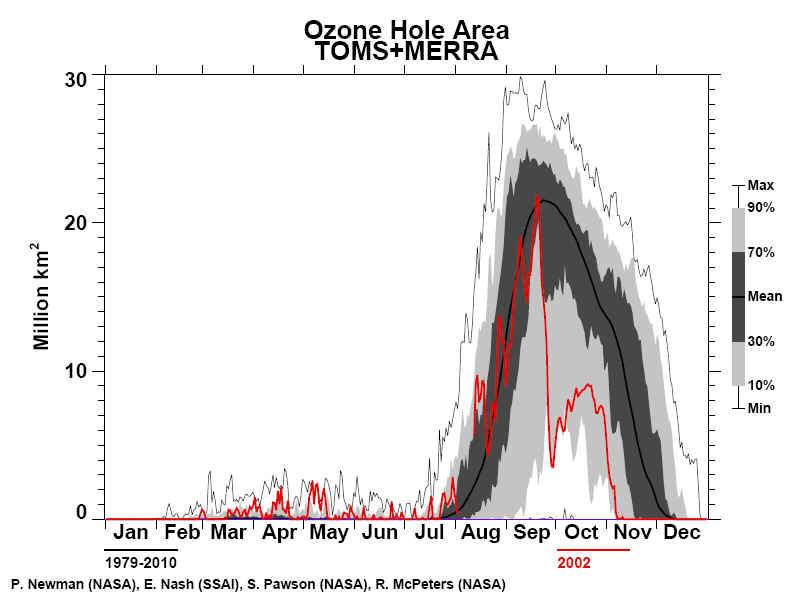
Ozone Hole Area
|
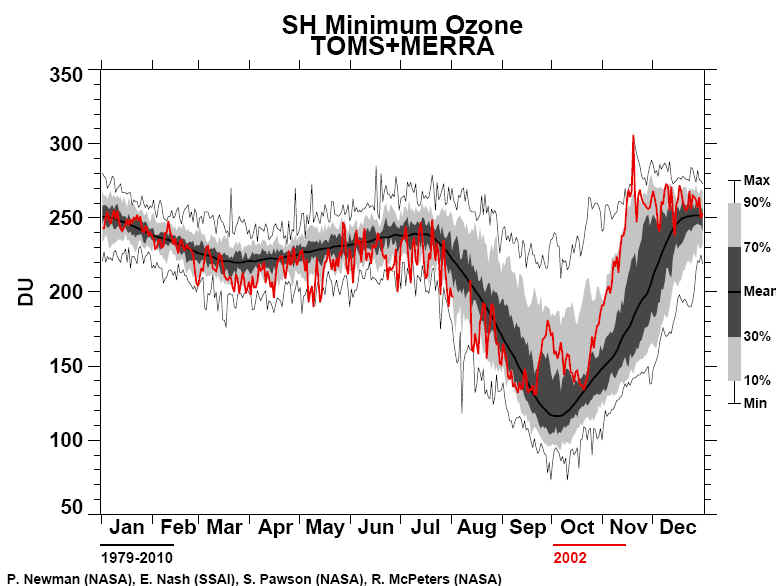
Minimum Ozone
|
|
(million km2) |
(DU) |
|
Maximum Daily |
Minimum Daily |
|
Year |
Date |
Value |
Date |
Value |
|
2002 |
19 September |
21.9 |
20 September |
131 |
http://ozonewatch.gsfc.nasa.gov
Waves in the Atmosphere Batter
South Pole, Shrink 2002 Ozone Hole
December 6, 2002
A greater number of large
“planetary sized waves” in the atmosphere that move from the lower atmosphere
into the upper atmosphere were responsible for the smaller Antarctic ozone hole
this fall, according to NASA researchers. The September 2002 ozone hole was half
the size it was in 2000. However, scientists say that these large-scale weather
patterns in the Earth’s atmosphere are not an indication that the ozone layer is
recovering.
Paul Newman, a lead researcher on
ozone at NASA’s Goddard Space Flight Center, Greenbelt, Md., said that large
scale weather patterns have an affect on ozone when large “planetary sized
waves” move up into ozone layer. If the waves are more frequent and stronger as
they move from the surface to the upper atmosphere, they warm the upper air.
Such weather phenomena are known as “stratospheric warmings.”
The stratosphere is an
atmospheric layer about 6 to 30 miles above the Earth’s surface where the ozone
layer is found. Ozone breaks down more easily with colder temperatures. A long
wave or planetary wave is a weather system that circles the world. It resembles
a series of ocean waves with ridges (the high points) and troughs (the low
points).
Typically, at any given time,
there are between one and three of these waves looping around the Earth. With
more or stronger atmospheric waves, temperatures warm aloft. The warmer the
upper air around the “polar vortex” or rotating column of winds that reach into
the upper atmosphere where the protective ozone layer is, the less ozone is
depleted.
Newman said, “The Southern
Hemisphere large scale weather systems are similar to the semi-permanent area of
high pressure, which brought sunshine and dry conditions over much of the
eastern United States during the 2002 summer.” These large Southern Hemisphere
weather systems generated more frequent and stronger planetary waves that caused
a series of stratospheric warmings during the Southern winter. Scientists aren’t
exactly certain why that happened. What they are certain of is that these waves
warmed the upper atmosphere at the poles, and cut ozone loss.
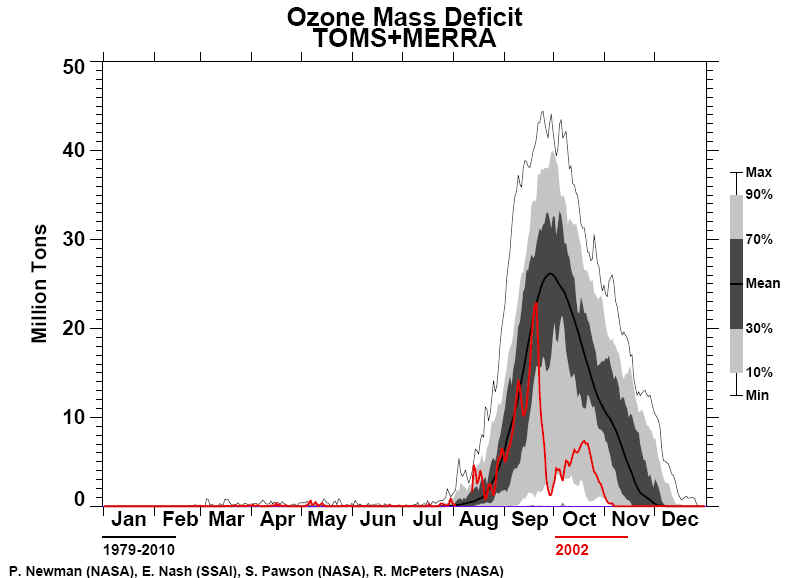
“2002 was a year of record
setting planetary waves in both frequency and strength,” Newman said. As a
result, the total area of the ozone hole over the Antarctic was just over 15
million square kilometers (km) (5.8 million square miles) in late September. The
ozone hole was virtually gone by late-October, one of its earliest
disappearances since 1988.
Comparatively, the 2001 Antarctic
ozone hole was over 26.5 million km squared (10.2 million square miles), larger
than the entire area of North America including the U.S., Canada and Mexico
combined. In the year 2000, it was approximately 30 million km squared (11.5
million square miles). The last time the ozone hole was as small as it is this
year was 1988, and that was also most likely due to large scale surface weather
systems.
“This is an entirely different
factor from chemicals in the atmosphere that affects the protective ozone
layer,” Newman said. The Montreal Protocol regulated chlorofluorocarbons (CFCs)
in 1987, because of their destructive affect on the ozone layer. However, CFCs
still linger in the upper atmosphere. “The main reason why the ozone hole is
smaller this year than last is simply because of higher temperatures from these
waves. Decreases of CFCs are only causing the ozone hole to decrease by about 1%
per year.” It could be an entirely different story next year, if similar weather
systems are not in place.
The waves affect the atmospheric
circulation in the Antarctic by strengthening it and warming temperatures, or
weakening it and cooling temperatures. Colder temperatures cause polar clouds to
form, which lead to chemical reactions that affect the chemical form of chlorine
in the stratosphere. In certain chemical forms, chlorine can deplete the ozone
layer. One theory is that greenhouse gases may be responsible for decreasing the
number of waves that enter the stratosphere, which then thins the ozone layer.
The temperature of the polar
lower stratosphere during September is a key in understanding the size of the
ozone hole - and the temperature at that time is usually driven by the strength
and duration of “planetary waves” spreading into the stratosphere.
Newman stressed that the smaller
ozone hole this fall is not an indication that the ozone layer is recovering. He
said it’s simply due to a change in global weather patterns for this year, and
next year it may likely be as large as it was last year.
This poster, “The 2002 Antarctic
Ozone Hole,” will be presented at the American Geophysical Union Fall 2002
Meeting in the Moscone Convention Center, in Hall D on Friday, December 6, 2002
at 8:30 a.m. (Pacific Time) Session # A51B-0044.
For more information and images:
http://www.gsfc.nasa.gov/topstory/20021206ozonehole.html.
###
Contact:
Robert J. Gutro
Goddard Spc Flt Ctr, Greenbelt, Md.
|
ANTARCTIC OZONE HOLE SPLITS IN TWO
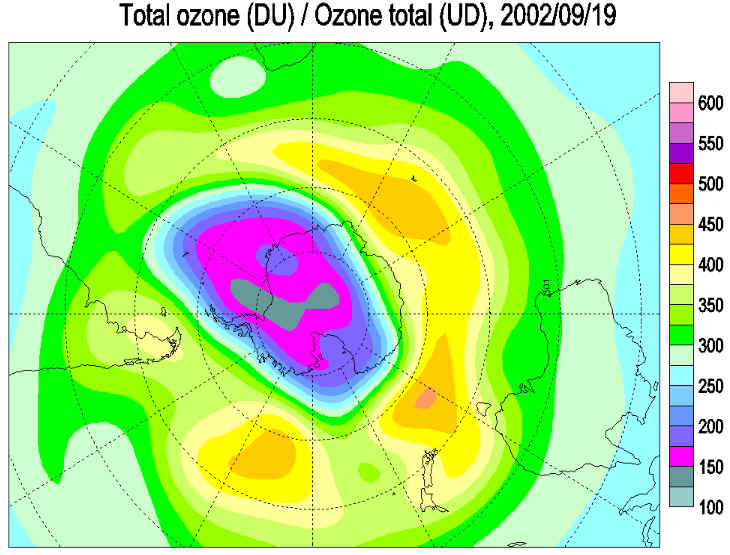
GENEVA, 1 OCTOBER, 2002 (WMO) – The Antarctic ozone hole has split in two,
which
is said to be ‘an unprecedented event’, according to experts of the World
Meteorological Organization (WMO) today. The Antarctic ozone hole split into two
smaller holes, last week, one centered west of the southern tip of South America
and the other centered southeast of the tip of Africa.
Less than two weeks ago WMO reported that the 2002 ozone hole was one of the
smallest in the
past decade, and that based upon previous years it would be expected to grow
somewhat larger
during the following weeks. However, last week an unprecedented split of the
Antarctic ozone
hole occurred. Although the two holes were relatively small, each contained a
core depleted of
more than 50% of its ozone. Since that time, the hole south east of Africa has
maintained its size
and intensity, while the hole near South America has weakened considerably.
Together the
depleted areas cover only a small part of Antarctica.
Although the Antarctic ozone holes during 2000 and 2001 were the largest ever,
this year’s ozone
hole is not matching those levels. Under full compliance with the present
international
agreements that would phase out production of practically all ozone depleting
compounds, it is
expected that the ozone layer will remain particularly vulnerable for another
decade. The total
amount of ozone depleting substances in the stratosphere is believed to have
reached or nearly
reached its maximum, and is expected to decrease to pre-ozone hole values in
about 50 years.
However, during this period, the size, depth and persistence of the ozone hole
will vary from year
to year due to natural changes in the meteorological conditions in the
stratosphere. This year’s
unusual ozone hole is seen as a response to the present unusual meteorological
conditions in the
stratosphere.
|
|
NASA September 30, 2002
UNUSUALLY
SMALL ANTARCTIC OZONE HOLE THIS YEAR ATTRIBUTED TO EXCEPTIONALLY STRONG
STRATOSPHERIC WEATHER SYSTEMS
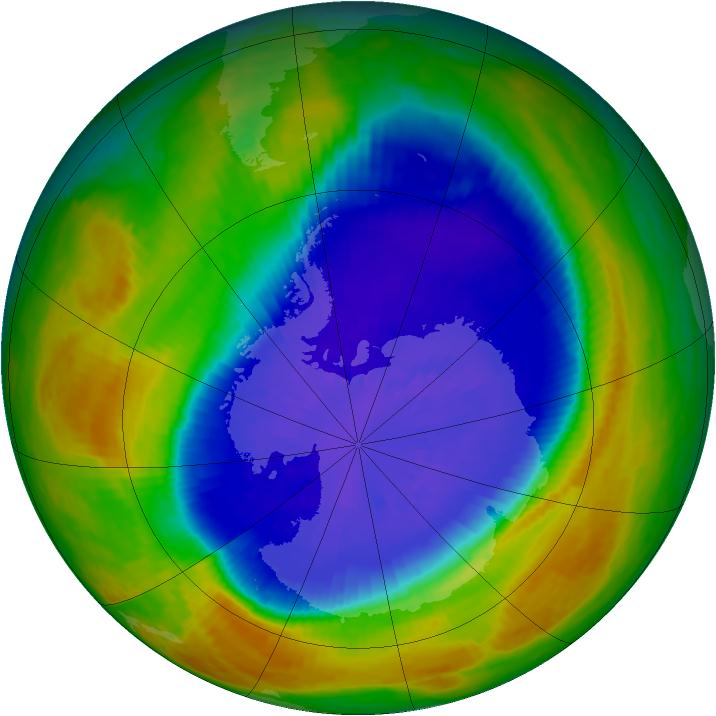
Scientists from NASA and the Commerce Department's National Oceanic and
Atmospheric Administration (NOAA) have confirmed the ozone hole over the
Antarctic this September is not only much smaller than it was in 2000 and 2001,
but has split into two separate "holes."
Environment Canada
Southern Hemisphere Ozone Map
The researchers stressed the smaller hole is due to this year's peculiar
stratospheric weather patterns and that a single year's unusual pattern does not
make a long-term trend. Moreover, they said, the data are not conclusive that
the ozone layer is recovering.
Paul Newman, a lead ozone researcher at NASA's Goddard Space Flight Center,
Greenbelt, Md., said this year, warmer-than-normal temperatures around the edge
of the polar vortex that forms annually in the stratosphere over Antarctica are
responsible for the smaller ozone loss.
Estimates for the last two weeks of the size of the Antarctic Ozone Hole (the
region with total column ozone below 220 Dobson Units), from the NASA Earth
Probe Total Ozone Mapping Spectrometer (EPTOMS) and the NOAA-16 Solar
Backscatter Ultraviolet instrument (SBUV/2), are around 15 million square
kilometers (6 million square miles). These values are well below the more-than
24 million sq. km. (9 million sq. mi.) seen the last six years for the same time
of year.
The stratosphere is a portion of the atmosphere about 6-to-30 miles above the
Earth's surface where the ozone layer is found. The ozone layer prevents the
sun's harmful ultraviolet radiation from reaching the Earth's surface.
Ultraviolet radiation is a primary cause of skin cancer. Without protective
upper-level ozone, there would be no life on Earth.
"The Southern Hemisphere's stratosphere was unusually disturbed this year," said
Craig Long, meteorologist at NOAA's Climate Prediction Center (CPC). The unusual
weather patterns were so strong, the ozone hole split into two pieces during
late September. NOAA's CPC has been monitoring and studying the ozone since the
early 1970s. "This is the first time we've seen the polar vortex split in
September," said Long.
At South Pole Station, balloon-borne ozone-measuring instruments launched by
NOAA's Climate Monitoring and Diagnostics Laboratory (CMDL) reveal the vertical
structure of the developing ozone hole. Bryan Johnson, a scientist with CMDL,
said the main ozone depletion region, from 7-to-14 miles above the Earth, has
large ozone losses, similar to the last few years. At more than 15 miles above
the Earth, surface measurements show higher-than-normal ozone concentrations and
higher temperatures.
The combination of these layers indicate total ozone levels in a column of
atmosphere will be higher than observed during the last few years, Johnson said.
However, some layers may still show complete ozone destruction by early October,
when ozone depletion is greatest.
In 2001, the Antarctic ozone hole was larger than the combined area of the
United States, Canada and Mexico. The last time the ozone hole was this small
was in 1988, and that was also due to warm atmospheric temperatures.
"While chlorine and bromine chemicals cause the ozone hole, temperature is also
a key factor in ozone loss," Newman said. The Montreal Protocol and its
amendments banned chlorine-containing chlorofluorocarbons (CFCs) and
bromine-containing halons in 1995, because of their destructive effect on the
ozone layer. However, CFCs and halons are extremely long-lived and still linger
at high concentrations in the atmosphere.
The coldest temperatures over the South Pole typically occur in August and
September. Thin clouds form in these cold conditions, and chemical reactions on
the cloud particles help chlorine and bromine gases to rapidly destroy ozone. By
early October, temperatures usually begin to warm, and thereafter the ozone
layer starts to recover.
NOAA and NASA continuously observe Antarctic ozone with a combination of ground,
balloon, and satellite-based instruments.
National Oceanic and Atmospheric Administration summary-Very
low ozone values were observed over Antarctica again in the Southern Hemisphere
winter of 2002. Ozone depletion of more than 40 percent was observed over
Antarctica compared to total ozone amounts observed in the early 1980's.
Vertical soundings over the South Pole during September and October 2002 again
showed strong destruction of ozone at altitudes between 15 and 20 km. However,
for the year 2002, the ozone hole declined rapidly in late September, and had
the shortest duration of any year since 1988. Lower stratosphere temperatures in
the winter and spring of 2002 over the Antarctic region were much higher than
average values. Associated with this, the ozone hole area was among the smallest
of recent years.
Observations of
chloroflourocarbons and of stratospheric hydrogen chloride support the view that
international actions are reducing the use and release of ozone depleting
substances ; Anderson et al., 2000). However, chemicals already in the
atmosphere are expected to continue to deplete ozone for many decades to come.
Further, changing atmospheric conditions that modulate ozone can complicate the
task of detecting the start of ozone layer recovery. The eruption of the
Pinatubo volcano provided an example of such a complication in the 1990s. Based
on an analysis of 10 years of South Pole ozone vertical profile measurements,
estimated that recovery in the Antarctic ozone hole may be detected as early as
the coming decade. Indicators include: 1) an end to springtime ozone depletion
at 22-24 km, 2) 12-20 km mid-September column ozone loss rate of less than 3 DU
per day, and 3) a 12-20 km ozone column of more than 70 DU on September 15. An
intriguing aspect of recent observations of the Antarctic stratosphere had been
the apparent trend towards a later breakup of the vortex in most recent years.
However, the limited size and duration of the 2002 ozone hole is attributed to
highly unusual meteorological conditions this year. A full explanation of such
meteorological anomalies is not yet available. Continued monitoring and
measurements, including total ozone and its vertical profile, are essential to
achieving the understanding needed to identify ozone recovery.
http://www.cpc.ncep.noaa.gov/products/stratosphere/winter_bulletins/sh_02/index.html
|
|
Ozone Measurement
1 Dobson Unit (DU) is defined to be 0.01 mm
thickness at STP (standard temperature and pressure). Ozone layer thickness is
expressed in terms of Dobson units, which measure what its physical thickness
would be if compressed in the Earth's atmosphere.
In
those terms, it's very thin indeed. A normal range is 300
to 500 Dobson units, which translates to an eighth of an inch-basically two
stacked pennies.
In space, it's best not to envision the ozone
layer as a distinct, measurable band. Instead, think of it in terms of parts per
million concentrations in the stratosphere (the layer six to 30 miles above the
Earth's surface).
|
|
NASA Earth Probe TOMS Images
Earth Probe TOMS is
currently the only NASA spacecraft on orbit specializing in ozone retrieval.
Comparison
ozone hole year 2001 development and growth with ozone hole year 2002
August 2002
September 2002
October 2002
November 2002
December 2002
|
Environment Canada
Southern Hemisphere Ozone Maps
Comparison ozone hole year 2001 development and growth with ozone hole
year 2002
May 2002
June 2002
July 2002
August 2002
September 2002
October 2002
November 2002
December 2002
|
|
Environment Canada
The total ozone maps are
based on ground-based measurements available from the
World Ozone and Ultraviolet Radiation Data Centre. Preliminary near
real-time data from ground-based observations were also used for the most recent
maps. Total ozone values are given in
Dobson Units. The numbers represent observations taken from ground stations
situated at the bottom left corner of the number.
Maps of deviations represent total ozone deviations from the
1978-1988 level estimated using
Total Ozone Mapping Spectrometer (TOMS) data for all areas except the
Antarctic and from the pre-1980 level estimated using Dobson data over the
Antarctic.
Over areas with poor data coverage adjustments are made
according to TOMS
on Nimbus-7, Meteor-3, ADEOS and Earth Probe satellites. Over the polar night
area Dobson and Brewer moon observations and/or
NOAA's TIROS Operational Vertical Sounder (TOVS) satellite data are used.
TOVS data are also used when the more reliable TOMS data are not available. The
mapping algorithm is similar to those used by the
WMO Ozone Mapping Centre.
NOAA's TIROS Operational Vertical Sounder(TOVS)
NOAA's TIROS Operational Vertical Sounder(TOVS) is a suite of three
instruments: the Microwave Sounding Unit(MSU), the High resolution
Infrared Radiation Sounder(HIRS), and the Stratospheric Sounding
Unit(SSU). Each instrument measures radiation emmitted by the Earth at
several different wavelengths. The HIRS channel 9 measures Earth's
emmitted infrared radiation at
9.7 microns (10-6 meters). This is a "window channel"
meaning that the radiation measured by the HIRS instrument is emmited from
the earth's surface (as opposed to radiation being emmitted at other
levels of the earth's atmosphere). The amount of radiation reaching the
HIRS instrument is dependant upon how much ozone is in the earth's
atmosphere (less ozone = more radiation). Therefore, the TOVS Total Ozone
algorithm uses this channel (along with information from other HIRS
channels) to estimate the total amount of ozone in the earth's atmosphere.
The greatest
contribution of the emmitted radiation occurs in a region between 200
hPa and 30 hPa (13km to 27km). This "lower stratosphere" region is below
the levels where the
greatest contribution to the total ozone amount occurs(50hpa to 10hPa
or 20km to 30km). Thus the ozone amount measured by the TOVS Total Ozone
algorithm is not a true measure of the "total" amount of ozone in the
earth's atmosphere. Rather it is a better measure of the ozone amount in
the lower stratosphere. To obtain a "total" ozone amount, the TOVS Total
Ozone algorithm adjusts the lower stratosphere ozone amount by a
climatological amount that is variable with season and latitude.
This is in contrast with satellite instruments which measure the amount of
backscattered radiation at various ultraviolet wavelengths. Backscattered
radiation levels at wavelengths where ozone absorbtion does and does not
take place are compared with the same wavelenghts measured directly from
the sun to derive a "total ozone" amount in the earth's atmosphere. This
methodology is used by the
NASA TOMS and the
NOAA SBUV/2 ozone monitoring programs. This methodology provides a
truer measure of the total ozone amount in the earth's atmosphere. One
drawback is that this method uses "backscattered" sunlight. Which means
that data cannot be retrieved in the earth's shadow or polar night
regions.
The TOVS Total Ozone algorithm can determine ozone amounts at all times
since it is derived from the Earth's emmitted infrared radiation. There
are drawbacks to the TOVS infrared methodolgy though. When the earth's
surface is either too cold (e.g., the high Antarctic Plateau) too hot
(e.g., the Sahara desert) or too obscured (e.g., by heavy tropical cirrus
clouds) the accuracy of this methodolgy declines.
|
|


