|
||||||||||||||||||||||||
|
WMO Antarctic Ozone Bulletin No 1 / 2008
The daily minimum temperatures at the 50 hPa level in the 50-90°S region have been close to or below the 1979- 2007 average throughout the winter. On most days from late June until early August the minimum temperatures at 50 hPa were below those of 2006 and 2007. During the last couple of weeks the minimum temperatures have increased somewhat and are now close to the 1979-2007 average and above those of 2006 and 2007.
The 50 hPa temperatures averaged over the 60-90°S region have been below the 1979-2007 average on most days since early June. A similar development is also seen at the 70 hPa level. At 30 hPa the 60-90°S region has been considerably colder than the 1979-2007 average since mid June. At 10 hPa this region has been colder than the longterm mean the whole winter and on almost every day since mid to late June it has been below the 1979-2007 extreme low.
Since late June, temperatures low enough for nitric acid trihydrate (NAT or PSC type I) formation have covered an area of more than 20 million square kilometres, or about 80% of the vortex area. Since the onset of NAT temperatures in mid-May the NAT area was close to the 1979-2007 average until late June. From early July until now the NAT area has been above the 1979-2007 average on most days and also above that of 2007, but below that of 2006. Presently the vortex is more circular than at the same time last year. This has led to an onset of ozone depletion that is close to the 1979-2007 average and somewhat later than last year, when the vortex was more elongated and more exposed to sunlight.
The geographical extent of the south polar vortex at the isentropic levels 460 K, 500 K, 550 K and 600 K has been higher than the 1979-2007 average on almost every day since early April. At the two upper levels, the vortex area has increased less than at the lower levels and is now oscillating around the 1979-2007 mean.
The longitudinally averaged heat flux between 45°S and 75°S is an indication of how much the stratosphere is disturbed. From April to the middle of July 2008, the heat flux was oscillating around the 1979-2007 average. In mid-July, the heat flux decreased somewhat and has, since then, been below the 1979-2007 average . This is a sign of a stable vortex.
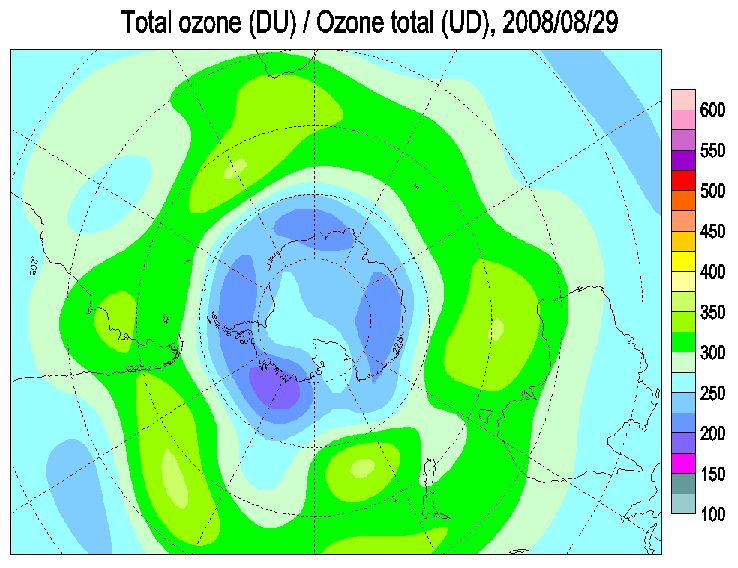
At the altitude of ~18 km the vortex is now almost entirely depleted of HCl, one of the reservoir gases that can be transformed to active chlorine. In the sunlit collar along the vortex edge there is 1.0 - 1.6 ppb of active chlorine (ClO), and some first signs of ozone depletion are visible. The south polar vortex is more concentric in 2008 than in 2007, and this has led to a relatively late onset of ozone depletion.
As the sun returns to Antarctica after the polar night, it is expected that ozone destruction will speed up. It is still too early to give a definitive statement about the development of this year's ozone hole and the degree of ozone loss that will occur. This will, to a large extent, depend on the meteorological conditions. The NAT area observed so far could indicate that the 2008 ozone hole will be smaller than the 2006 ozone hole but larger than the one of 2007.
WMO and the scientific community will use ozone observations from the ground, from balloons and from satellites together with meteorological data to keep a close eye on the development during the coming weeks and months.
http://www.wmo.int/pages/prog/arep/documents/ant-bulletin-1-2008.pdf
|