|
Ozone Hole 1999
http://ozonewatch.gsfc.nasa.gov
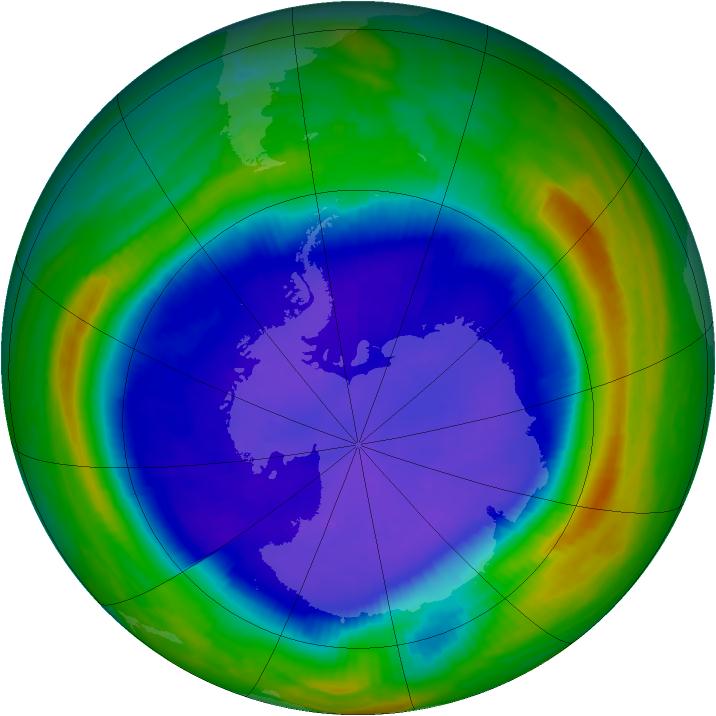
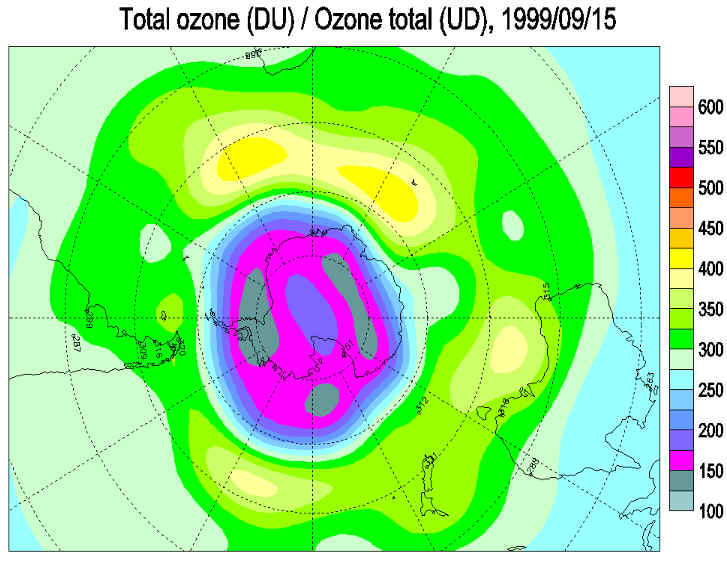
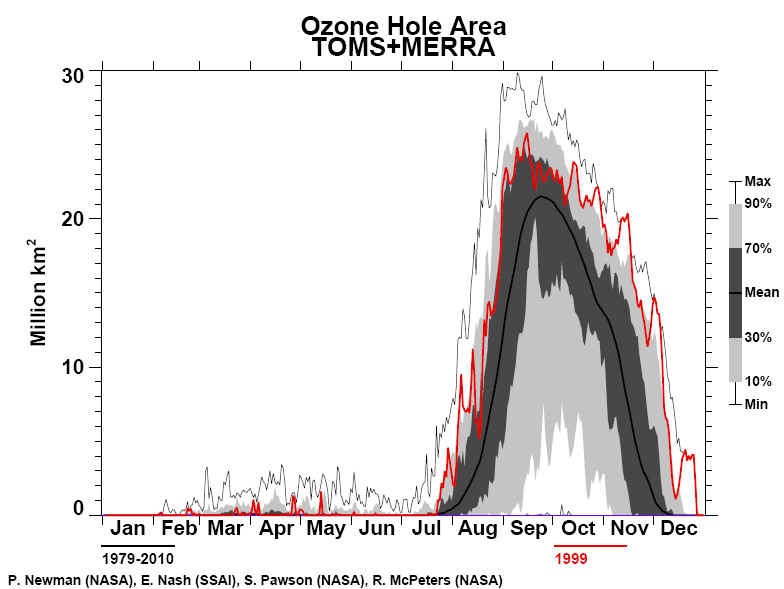
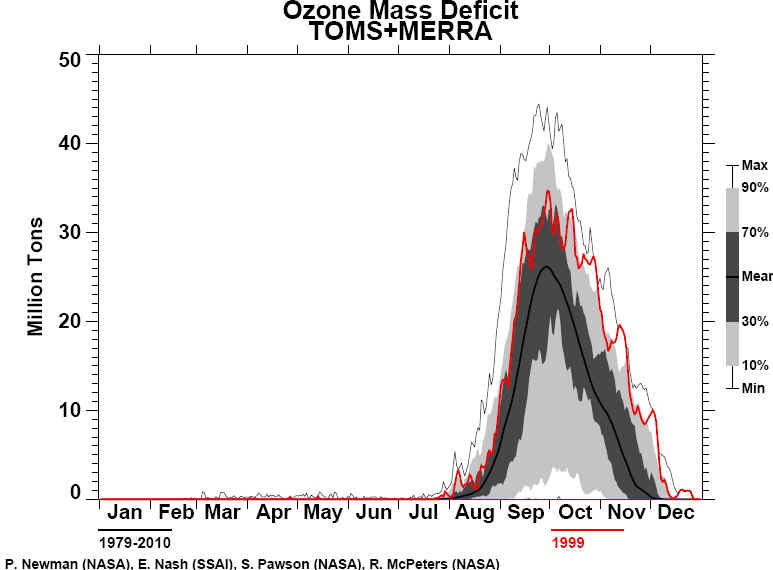
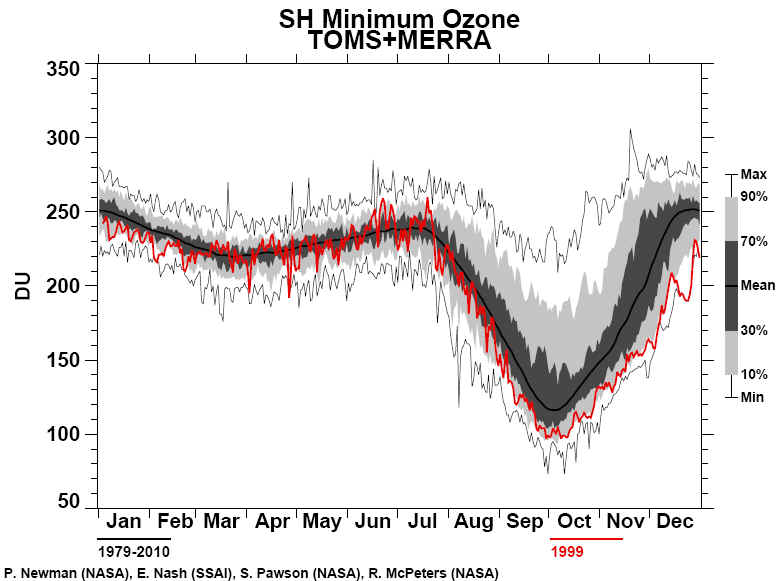
WMO Antarctic Ozone Summary for 1999 Meteorological conditions This year the minimum daily temperatures in the stratosphere were generally lower than the previous two years, with October and November minimum temperatures being somewhat lower than observed in the past decade. Nevertheless, the PSC area was very similar to the average over the last decade. Similar to the previous four years, PSC activity ended in mid November while the area of the polar vortex in this month was the largest observed in the last ten years. Ozone observations The ozone hole area remained rather large from mid September to mid October, with the average October area being the second largest ever observed. During November and December the area was comparable to 1998, reflecting the very large vortex at this time. As in 1997 and 1998, the ozone hole was very deep. The monthly average values of OMD as well as the zonal monthly averages were virtually identical to 1998. However, the area with ozone values more than 50% below pre-ozone hole norms didn't reach the record level of 1998 and ground based stations also did not report record breaking ozone values. The shape of this ozone hole was generally circular and centered over the Pole through mid November when it became elongated. Conditions over the populated regions In 1999 there were fewer days of low column ozone over the populated regions around Antarctica than were observed during the last two years. The ozone hole being generally circular and centered over the pole through mid November never extended over South America. The greatest deviation from pre-ozone hole norms over the southern tip of South America was 30% and was reached on three days in this year, first on 18 October, then 21 November and finally on 5 December. However, from mid to late October this region generally measured ozone values not more than 20% below pre-ozone hole norms, thus well above ozone hole values. However, the persistence of these depressed ozone values will generally result in an increased exposure to UV radiation. In September, New Zealand experienced ozone values 20% below norms on three days and 25% below norms on another. British Antarctic Survey summary 1999- The ozone layer over Antarctica evolved in a broadly similar way in 1999/2000 to each of the past few years. Significant ozone depletion over Halley had already occurred by late August and maximum depletion, of 60%, occurred in early October. The ozone hole filled rapidly in early December, however a remnant area over central Antarctica, with ozone values below 240 DU, persisted until early February. Ozone values remained at around 255 DU at Halley for the rest of the season (15% below the normal). At Vernadsky ozone values slowly fell from a peak in mid December until the end of March but rose by 30 DU in April. Stratospheric temperatures at Halley remained below the normal from late September until early April. |
||||||||||||||||||||||||