|
The Ozone Hole 2000
http://ozonewatch.gsfc.nasa.gov
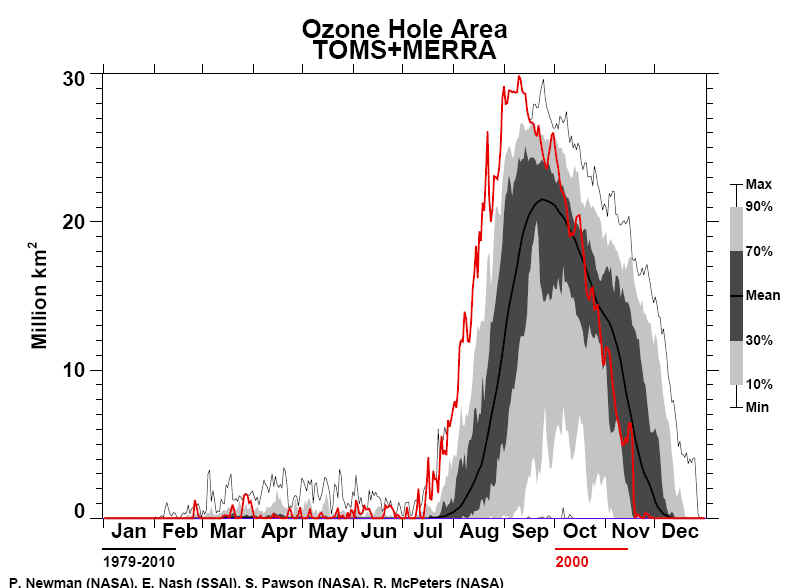
British Antarctic Survey summary-The 2000 ozone hole reached its greatest extent in early September at 28.4 million square kilometres and was the largest ever-recorded ozone hole. It reached this maximum extent unusually early, as the hole is normally largest in late September. Minimum ozone values were measured in early October and were amongst the lowest on record. The edge of the ozone hole passed over the tip of South America and the Falkland Islands for significant periods between October 6 and 24. The hole also closed in unusually early and the event was essentially over by early December. This early closure of the hole is probably linked with the QBO/ENSO and in retrospect was to be expected. Satellite imagery gives a global perspective on the ozone hole. TOVS and TOMS currently have significantly different calibrations, with TOVS reading some 30 DU higher than TOMS. TOMS values are close to ground-based values. Stratospheric clouds were sighted from Vernadsky, Rothera and Halley. A mini ozone hole, with central values below 200 DU, periodically formed to the east of the Antarctic Peninsula over the Weddell Sea during July. This mini ozone hole probably formed due to processing of ozone through PSCs, which are far enough north to be sunlit. The feature was particularly marked on July 10 and again on July 20. Ozone values over the Arctic are normally at their lowest in September and 2000 was no exception as can be see from the TOMS images. Although the values were low, they were low because of stratospheric dynamics and not chemistry. The temperature in the Arctic ozone layer was above –55 °C, far too warm for stratospheric clouds to form. Hence there was no chemical depletion taking place and no ozone hole above the Arctic. In mid October there were regions of low ozone over Siberia. Stratospheric temperatures in this area were generally above –65 °C, so again these features had a dynamic, not chemical origin. The temperature of the Arctic stratosphere did fall below the threshold for PSC formation at times in small regions during 2001 January and February. These regions developed ozone values lower than elsewhere in the Arctic, and in mid February values below 250 DU were recorded by TOMS over a small area of northwest Europe. Ozone values are currently high over most northern temperate and polar latitudes.
7 September 2000- Japan's Meteorological Agency on Tuesday September 5 said the size of the hole in the ozone layer over the Antarctic is at its largest ever -- more than twice the size of the surface of the Antarctic -- due to low temperatures beneath the stratosphere. The hole was estimated to be 28.4 million square kilometers on Sunday, larger than the previous worst record of 27 million sq. km in 1998, agency officials said. The ozone layer does a remarkable job of absorbing ultraviolet radiation. In the absence of this gaseous shield in the stratosphere, the harmful radiation has a perfect portal through which to strike Earth. This biologically damaging, high-energy radiation can cause skin cancer, injure eyes, harm the immune system, and upset the fragile balance of an entire ecosystem.
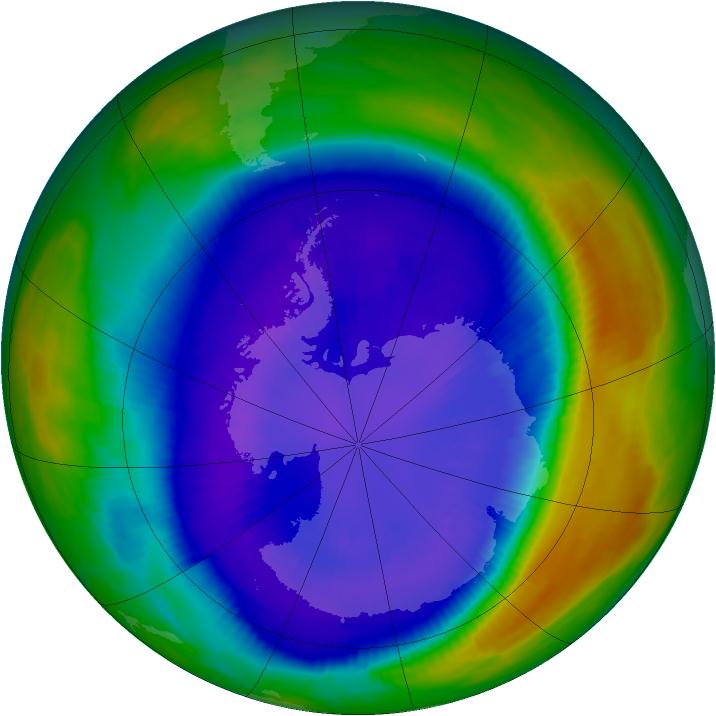
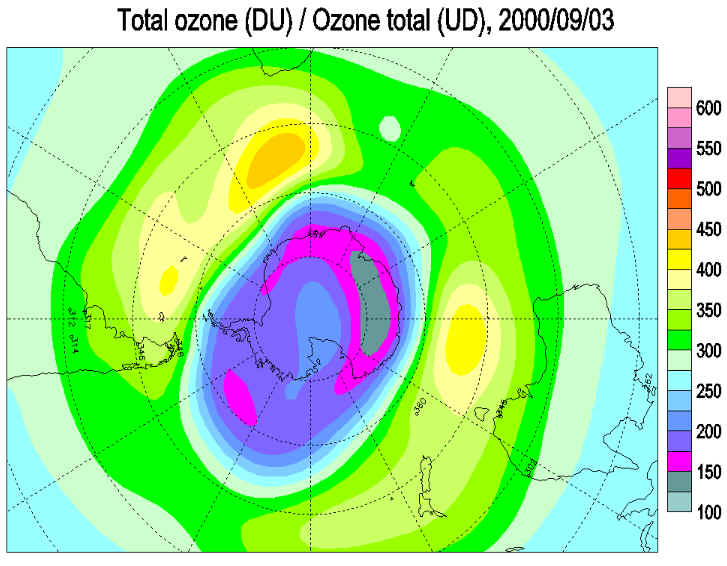
NASA Press Release LARGEST-EVER OZONE HOLE OBSERVED OVER ANTARCTICA 9September 2000-A NASA spectrometer has detected an Antarctic ozone "hole" (what scientists call an "ozone depletion area") that is three times larger than the entire land mass of the United States - the largest such area ever observed. The "hole" expanded to a record size of approximately 11.5 million square miles (30.3 million square kilometers) on Sept. 3, 2000. The previous record was approximately 10.5 million square miles (28.2 million square km) on Sept. 19, 1998. The ozone hole's size currently has stabilized, but the low levels in its interior continue to fall. The lowest readings in the ozone hole are typically observed in late September or early October each year. "These observations reinforce concerns about the frailty of Earth's ozone layer. Although production of ozone-destroying gases has been curtailed under international agreements, concentrations of the gases in the stratosphere are only now reaching their peak. Due to their long persistence in the atmosphere, it will be many decades before the ozone hole is no longer an annual occurrence," said Dr. Michael J. Kurylo, manager of the Upper Atmosphere Research Program, NASA Headquarters, Washington, DC. Ozone molecules, made up of three atoms of oxygen, comprise a thin layer of the atmosphere that absorbs harmful ultraviolet radiation from the Sun. Most atmospheric ozone is found between approximately six miles (9.5 km) and 18 miles (29 km) above the Earth's surface. Scientists continuing to investigate this enormous hole are somewhat surprised by its size. The reasons behind the dimensions involve both early-spring conditions, and an extremely intense Antarctic vortex. The Antarctic vortex is an upper-altitude stratospheric air current that sweeps around the Antarctic continent, confining the Antarctic ozone hole. "Variations in the size of the ozone hole and of ozone depletion accompanying it from one year to the next are not unexpected," said Dr. Jack Kaye, Office of Earth Sciences Research Director, NASA Headquarters. "At this point we can only wait to see how the ozone hole will evolve in the coming few months and see how the year's hole compares in all respects to those of previous years." "Discoveries like these demonstrate the value of our long-term commitment to providing key observations to the scientific community," said Dr. Ghassem Asrar, Associate Administrator for NASA's Office of Earth Sciences at Headquarters. "We will soon launch QuickTOMS and Aura, two spacecraft that will continue to gather these important data." The measurements released today were obtained using the Total Ozone Mapping Spectrometer (TOMS) instrument aboard NASA's Earth Probe (TOMS-EP) satellite. NASA instruments have been measuring Antarctic ozone levels since the early 1970s. Since the discovery of the ozone "hole" in 1985, TOMS has been a key instrument for monitoring ozone levels over the Earth.
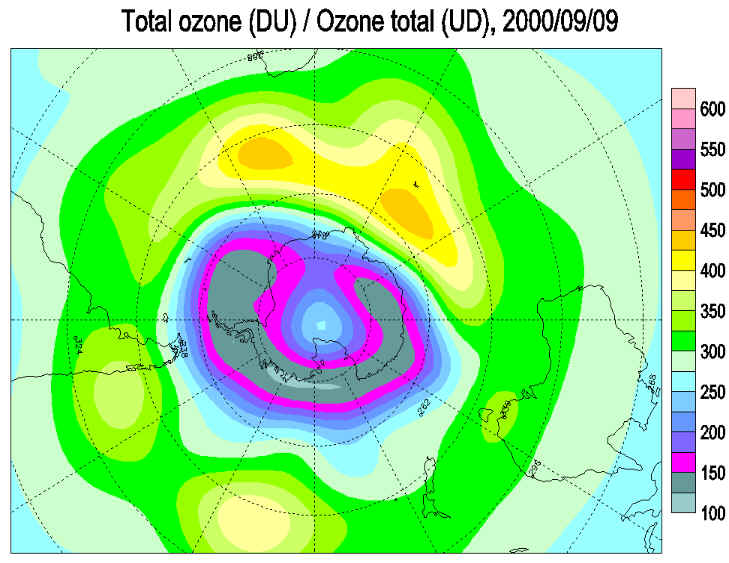
Environment Canada Southern Hemisphere Ozone Map September 3,2000
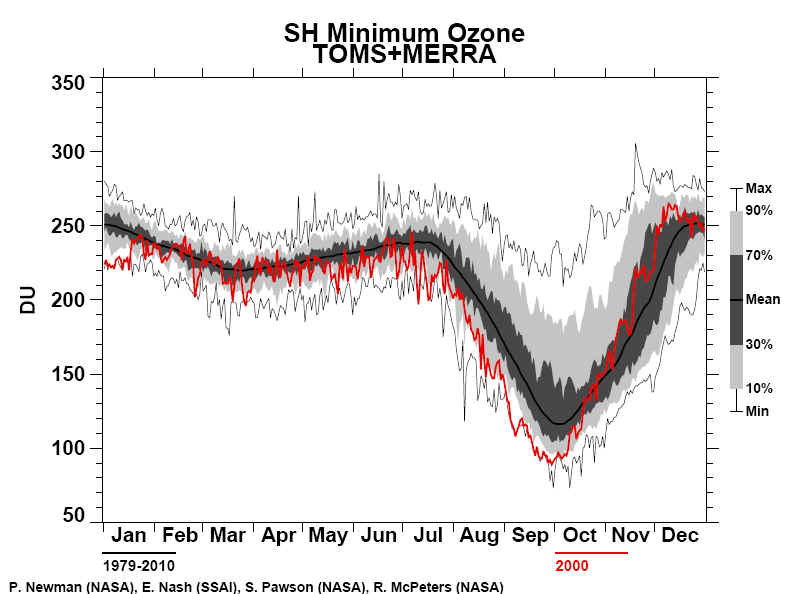
NOAA 2000-072 OZONE HOLE EARLIER, BUT NOT DEEPER IN 2000 Scientists from the Commerce Department's National Oceanic and Atmospheric Administration report that measurements of this year's ozone hole at the South Pole show that ozone depletion occurred earlier there, but did not reach the very lowest values of some recent years. The ozone hole, a region of ozone depletion over Antarctica, is the result of complex chemical and meteorological processes that occur in the stratosphere. Using instrumented balloons to take vertical profiles of the ozone at the South Pole, researchers from NOAA's Climate Monitoring and Diagnostics Laboratory located in Boulder, Colorado, reported that the September decline in ozone occurred about six days earlier than in any previous year and, as observed in other recent years, ozone was totally destroyed between about 9 and 13 miles altitude. Total column ozone reached the minimum reading of 98 Dobson units on September 29, compared to 90 Dobson units in 1999. The record low of 88 Dobson units was observed in 1993. A Dobson unit is a unit of measurement that describes the thickness of the ozone layer in a column directly above the location being measured. Prior to the springtime period in Antarctica, when ozone depletion occurs, the normal Dobson unit reading is around 275. Another measure of the severity of the ozone hole is its total area. Estimates of the area of the ozone hole are made at NOAA's Climate Prediction Center by analysis of measurements made by the Solar Backscatter Ultraviolet (SBUV/2) instruments on NOAA's Polar-orbiting Operational Environmental Satellites operated by NOAA's National Environmental Satellite, Data, and Information Service. Satellite data show the ozone hole area was over 27 million square kilometers for three days in early September, peaking at 28.5 million square kilometers. "This is the largest geographical size on record and comparable to the area of North America", said Lawrence Flynn, a physical scientist at NESDIS. The ozone hole is defined as the size of the region with total ozone below 220 Dobson units. NASA released similar measurements using the Total Ozone Mapping Spectrometer (TOMS) aboard NASA's Earth Probe (TOMS-EP) satellite. NOAA and NASA satellites have been measuring Antarctic ozone levels for almost 30 years. Continued monitoring by satellite instruments over the next two months will establish how long-lived the current year's ozone hole will be. "Even though the geographical size of the ozone hole was the largest on record and the ozone depleted earlier than ever, the severity of the ozone depletion within the hole reached about the same levels as the past few years," said David Hofmann, director of CMDL. "Year-to-year fluctuations in the geographical size of the ozone hole and the timing of the ozone reduction are believed to be related to meteorological factors such as temperature and winds, rather than further increases in ozone-destroying chemicals in the atmosphere," Hofmann said. Each spring when the sun rises over Antarctica, chemical reactions involving chlorine and bromine from man-made CFCs (chlororfluorocarbons) and bromine-containing compounds, occur in the stratosphere destroying ozone and causing the "ozone hole." The global ozone layer has also deteriorated since 1980 but not to the extent that is observed each spring in Antarctica. An international assessment of the status of the global ozone layer, produced by hundreds of scientists for the World Meteorological Organization and the United Nations Environmental Program in 1998, indicated that the amount of chlorine in the stratosphere from CFCs should soon be reaching a maximum due to regulations on emissions as dictated by the Montreal Protocol on substances that deplete the ozone layer and subsequent amendments. The amount of chlorine in the atmosphere at the surface of the Earth was measured by CMDL to have begun declining already in 1994. The thinning of the ozone layer is a matter of concern because the ozone layer protects the Earth from the harmful effects of the sun's ultraviolet radiation, which affects life on Earth and contributes to skin cancer and cataracts in humans. Hofmann says that "since chlorine in the atmosphere has reached nearly constant levels, annual variations in temperature, which affect the rate of the chemical reactions, will be the dominant factor in determining differences in the magnitude of the ozone hole. Total recovery of the ozone hole back to levels observed before 1980 will take at least 50 years, and expected changes in climate, including a cooler stratosphere, could cause a delay in the recovery of the ozone layer." Note to editors: Balloonborne ozone profiles and an animation of the profiles from the South Pole is available at: http://www.cmdl.noaa.gov For color images of
the ozone hole and stratospheric temperature Daily monitoring of
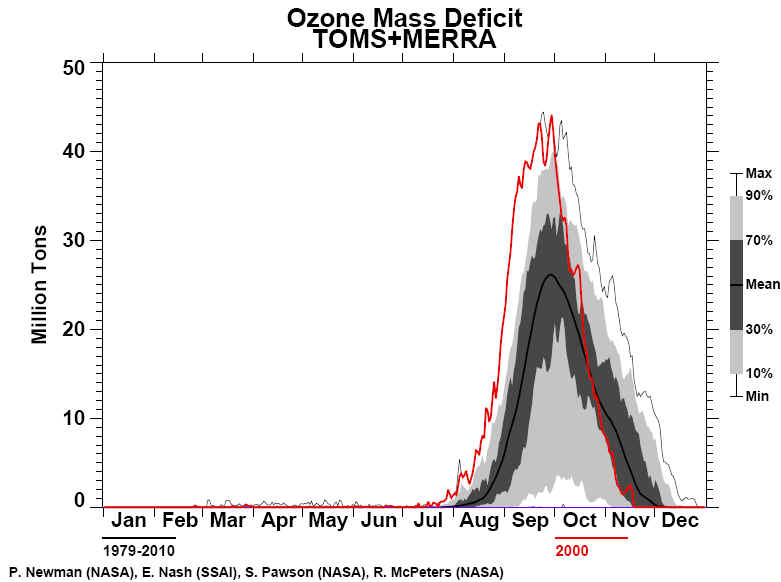
the SBUV/2 measurements is provided at: WMO Antarctic Ozone Summary for 2000 Meteorological conditions The minimum temperatures from July through October were somewhat lower than in the last decade. Therefore, the area with temperatures low enough to produce PSCs during August and September somewhat exceeded the previous years in the last decade. This was not the case for October, and PSC activity ended by November 1, which is earlier than usual. From July to September the vortex was one of the largest in recent years although in mid October the area decreased rapidly when compared to recent years. Ozone observations The meteorological conditions during winter set the stage for an earlier than usual development of the Antarctic ozone hole. Moreover, the maximum area of the ozone hole was the largest on record (about 27 million km2) and appeared on 13 September, which was earlier than usual. Also in September, the monthly average ozone hole area exceeded all previous years. As with the PSC and vortex areas, a very rapid decrease in the size of the ozone hole occurred in October, and by late October the ozone hole was the smallest of the past decade. By mid November the ozone hole had disappeared. While this ozone hole was very deep with an average September OMD comparable to the previous three years, it was one of the shallowest during October and November. The abrupt change in depth and size was also seen in the high latitude monthly zonal averages. The area with ozone values with more than 50% deviation from pre-ozone hole norms was unusually large in early September and continued into early October. Most of the Antarctic GAW ground-based stations also measured their lowest daily values ever. From September to early October the ozone hole was elongated, becoming more circular by mid October. Conditions over the populated regions The southern tip of South America experienced average ozone values about 30% below pre-ozone hole norms during the second half of September and the second half of October. Furthermore, the station in Ushuaia frequently measured very low ozone values, including a total of 14 days under the ozone hole, a record for this location. Highly depleted air extended several times towards South America during September and October. On 12 October Ushuaia reported a record breaking ozone value more than 50% below pre-ozone hole norms. The UV index for this day was above 11, a value comparable to UV exposure in the Tropics. However, beginning in late October Ushuaia observed near normal values. In late August, New Zealand experienced ozone values about 25% below pre-ozone hole norms for four days, and in early September they had values up to 20% below norms for three days. Column ozone over Tasmania was observed to be 20% below norms on one day in early September.
|
||||||||||||||||||||||||