|
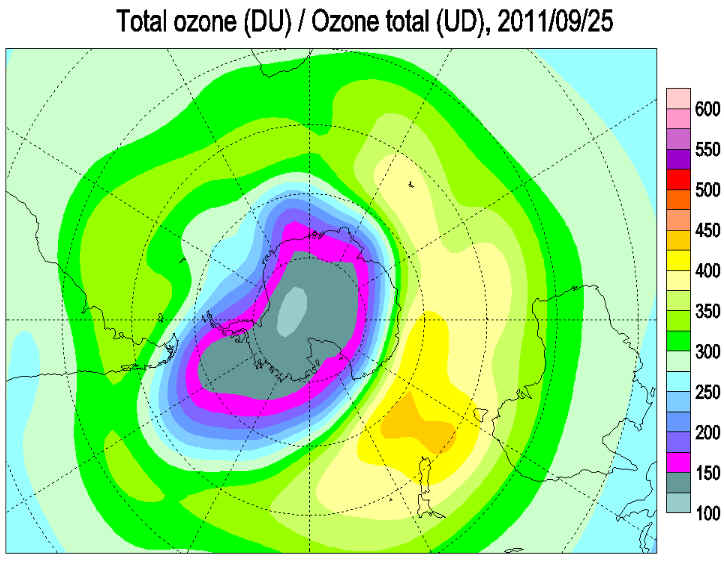
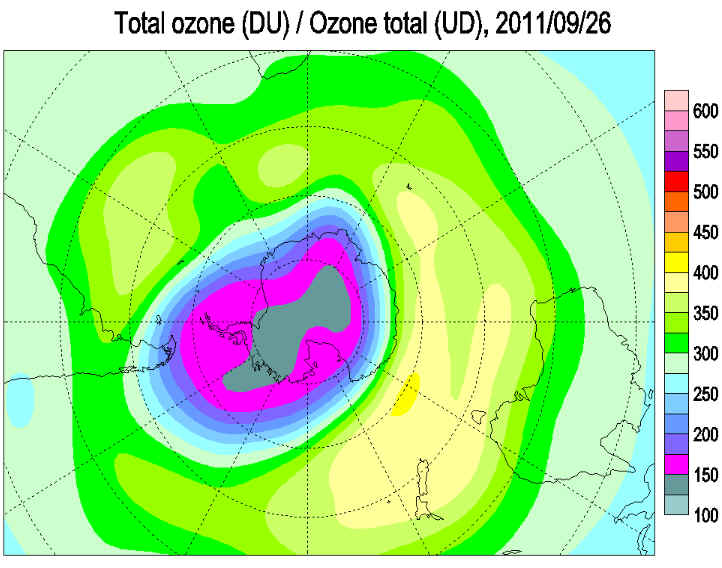
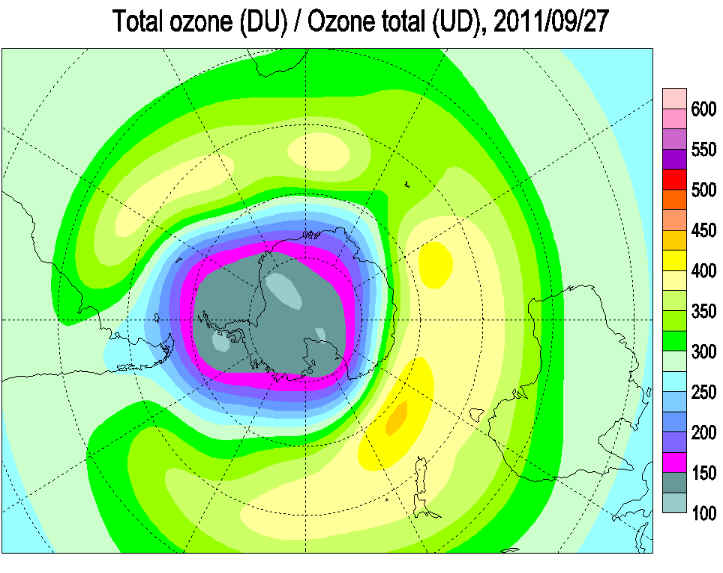
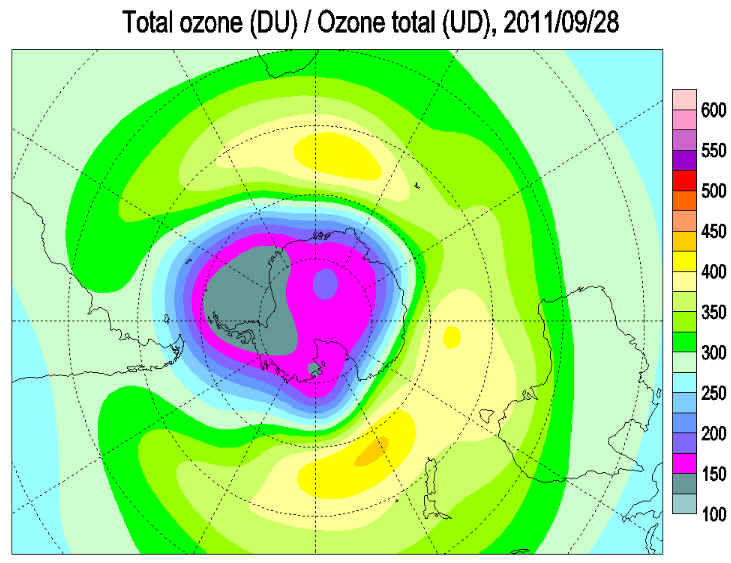
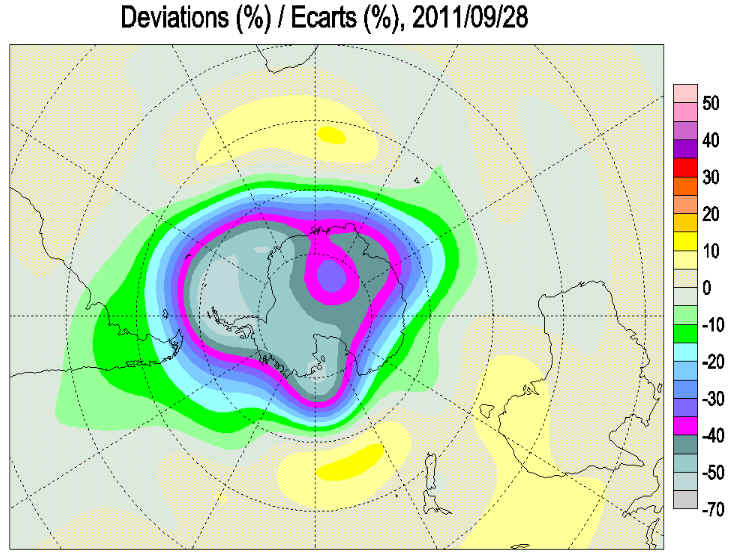
The Ozone Hole Reaches South America
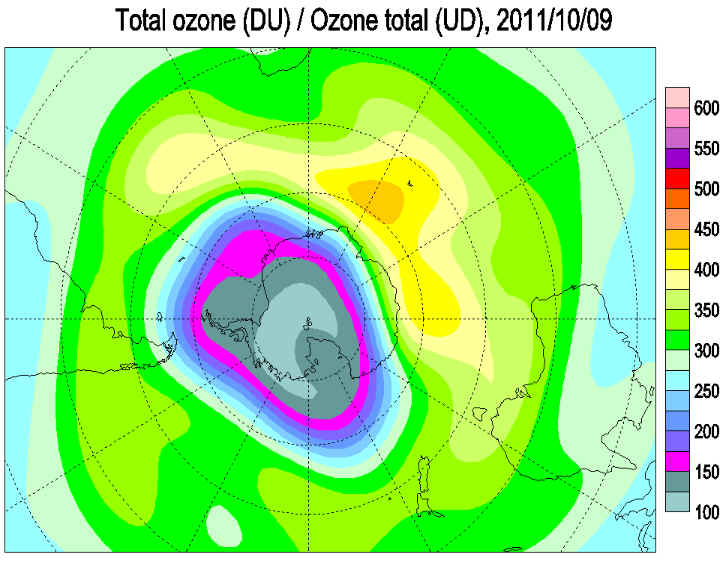
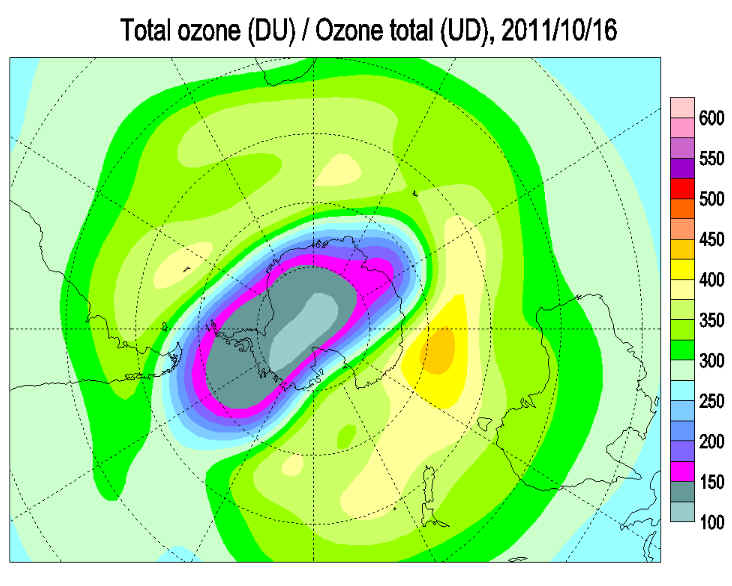
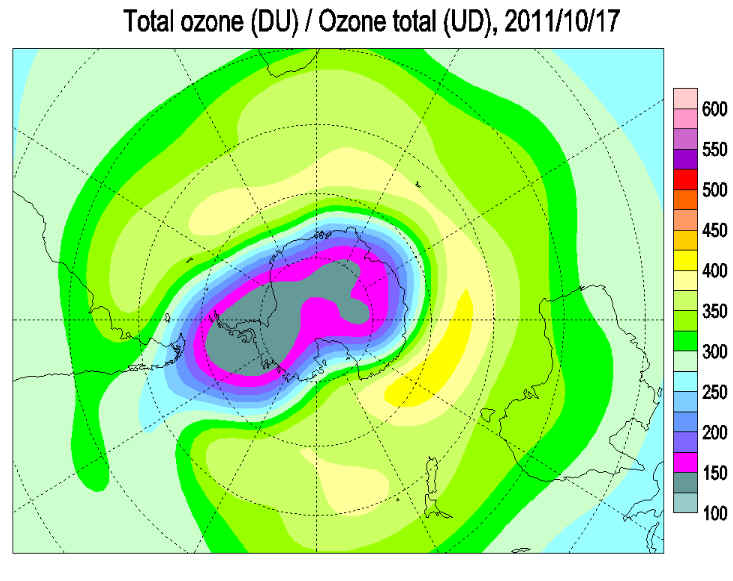
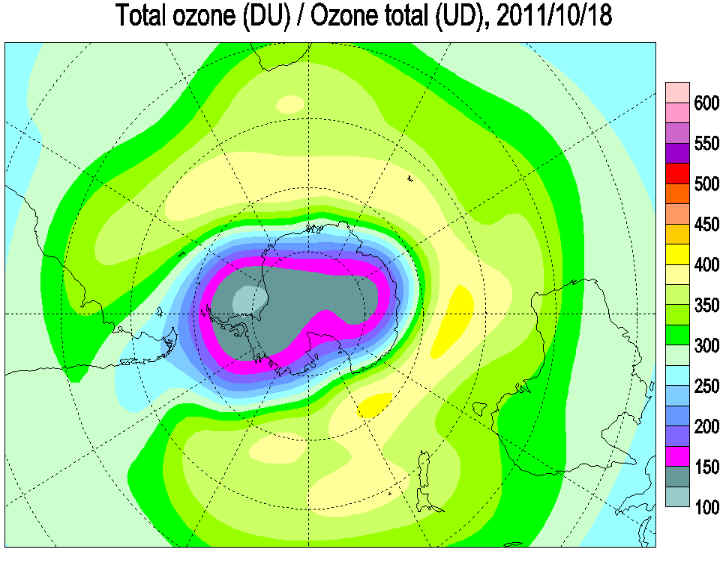
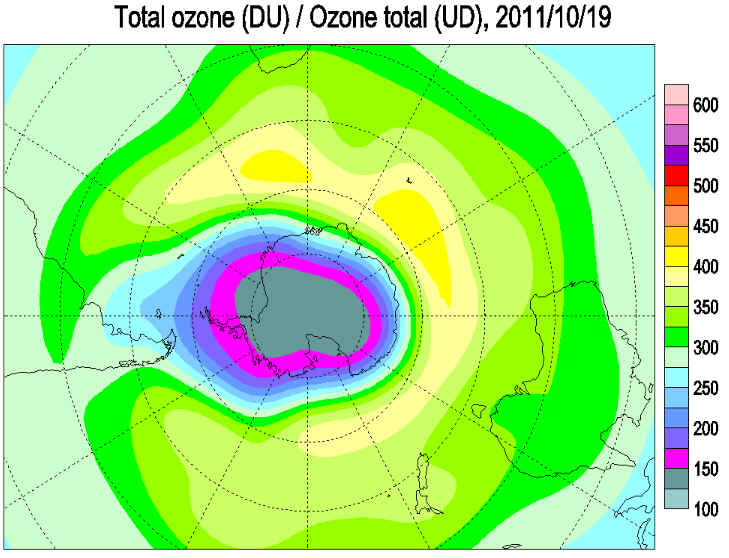
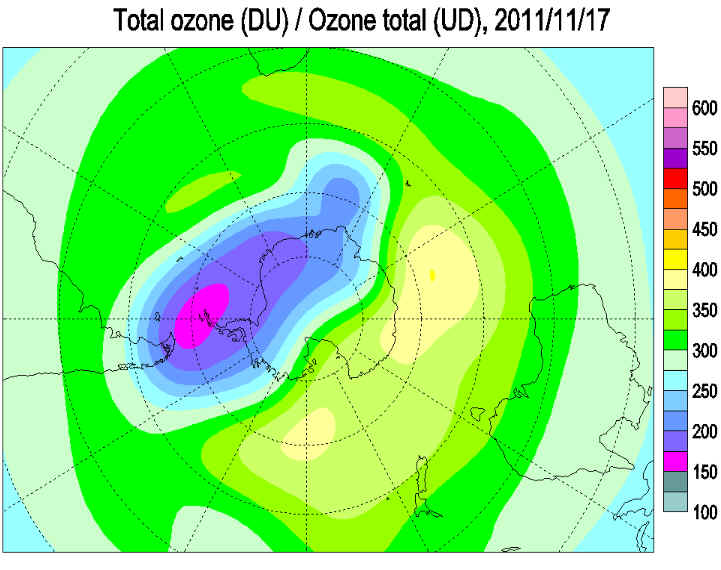
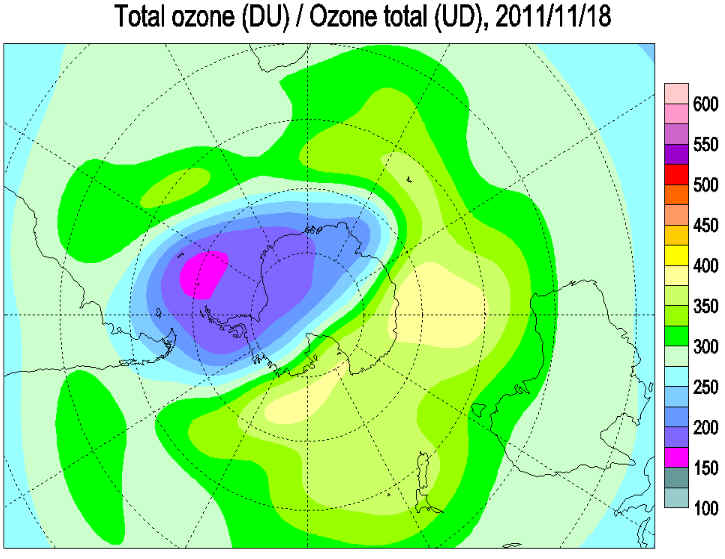
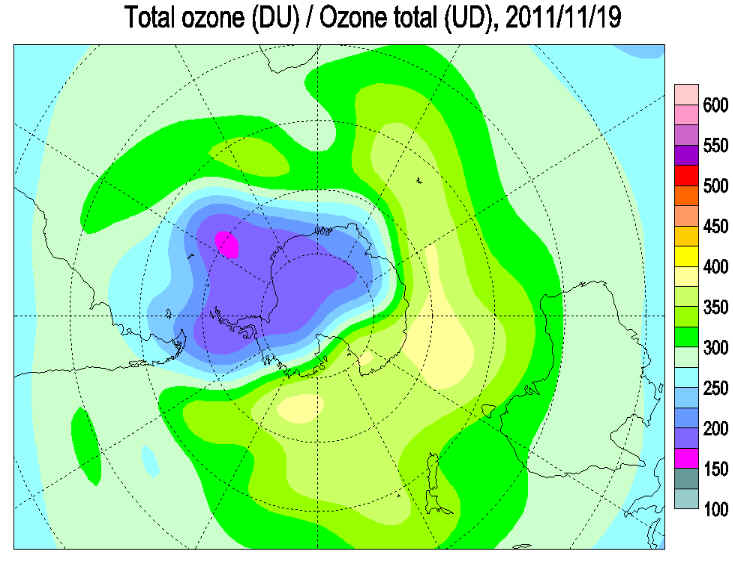
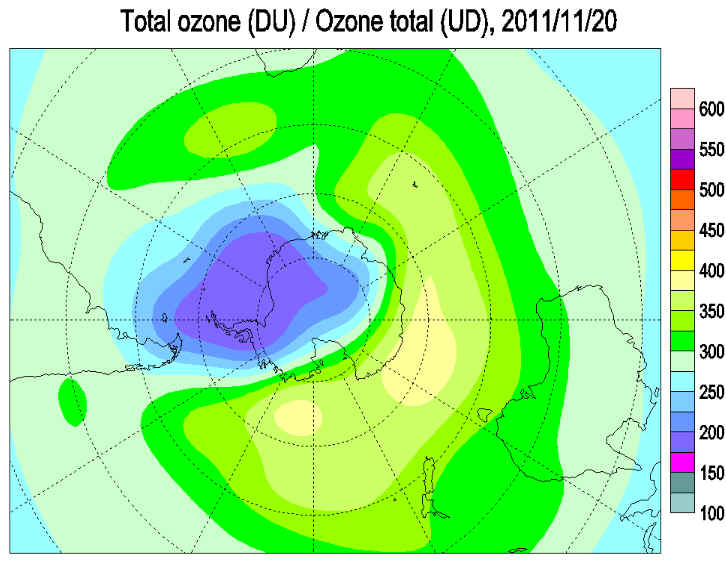
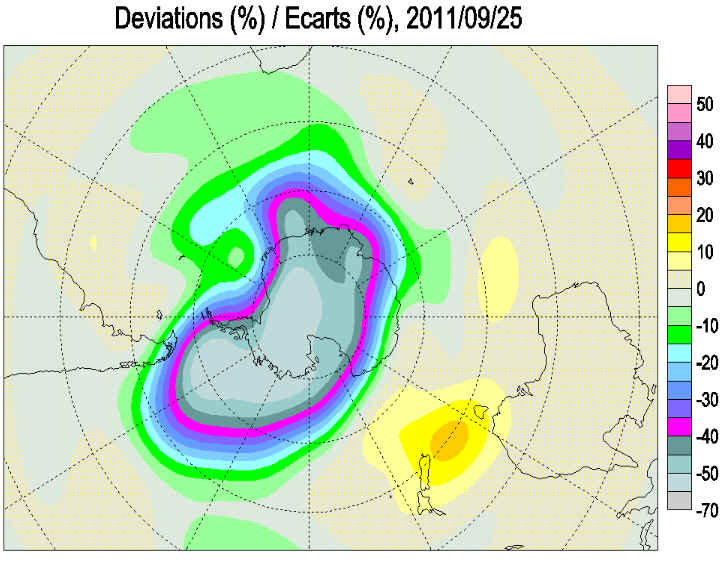
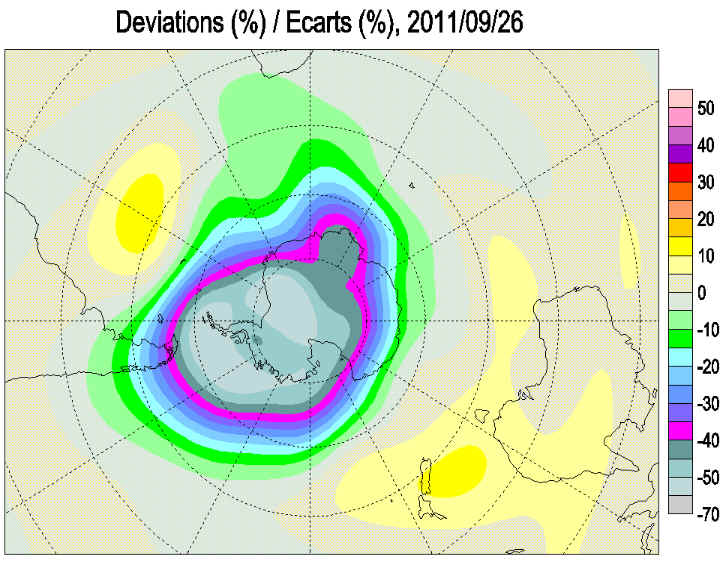
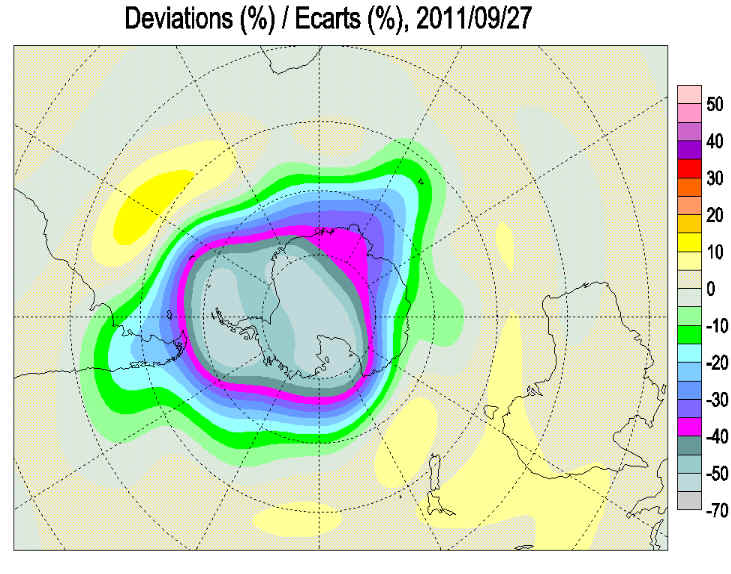
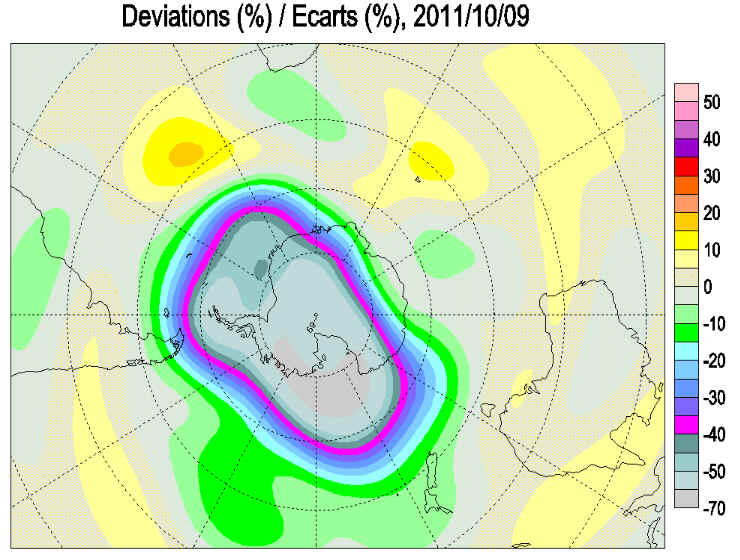
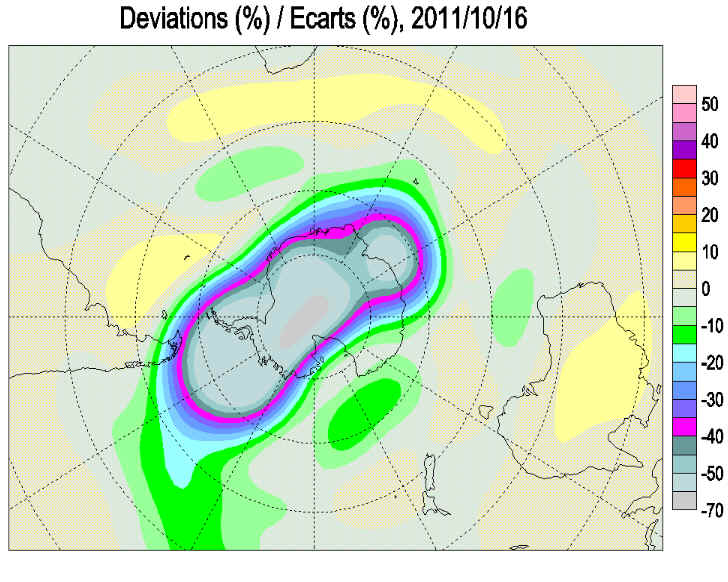
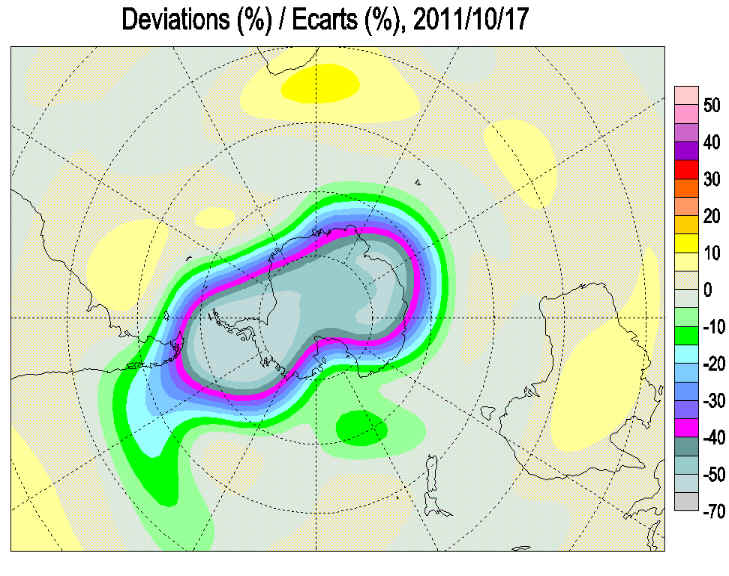
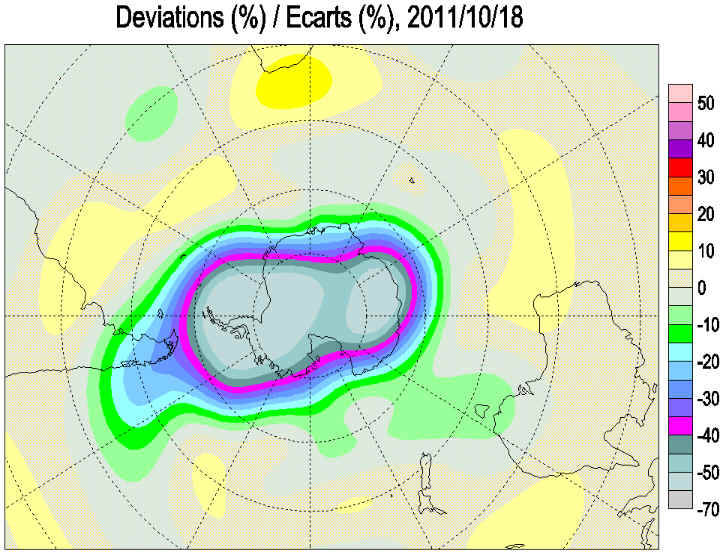
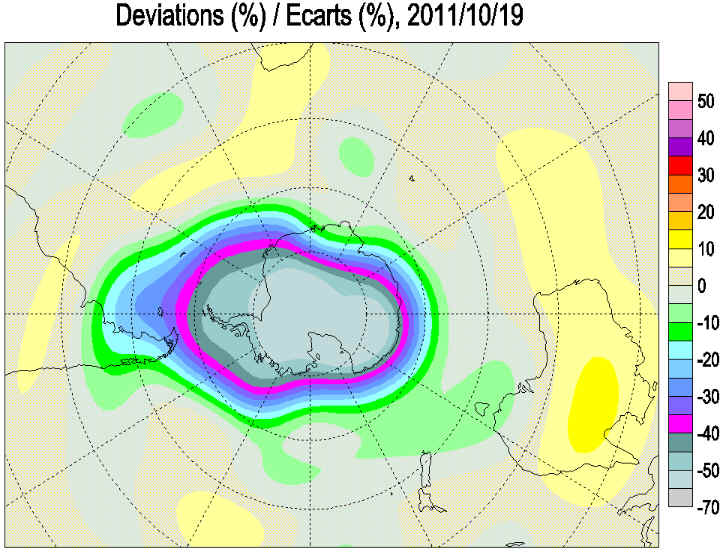
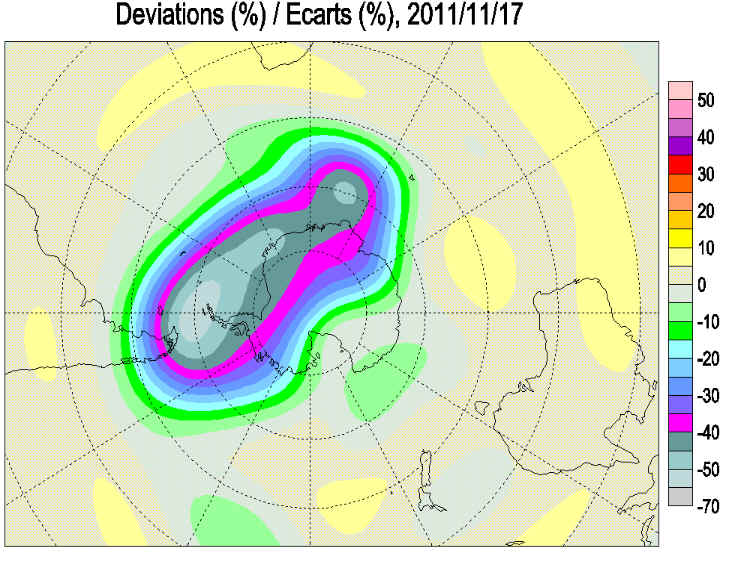
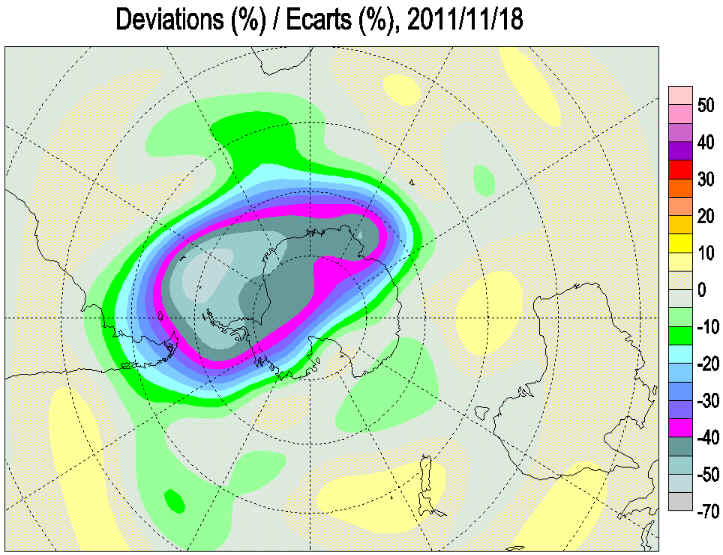
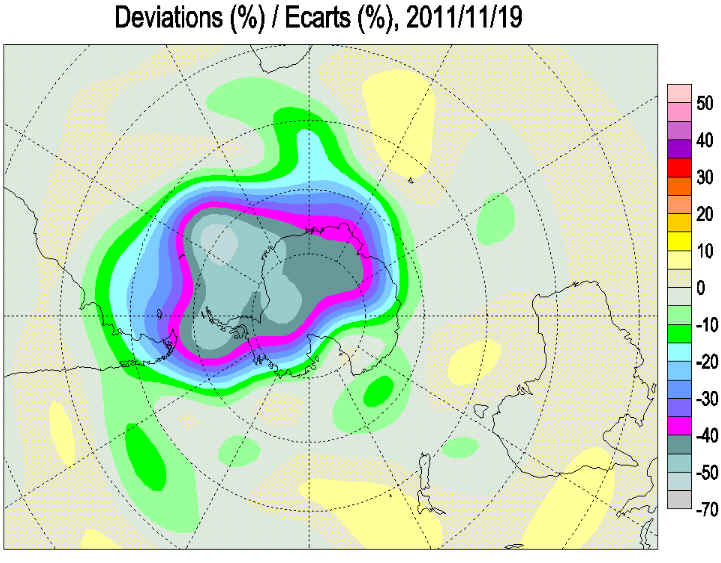
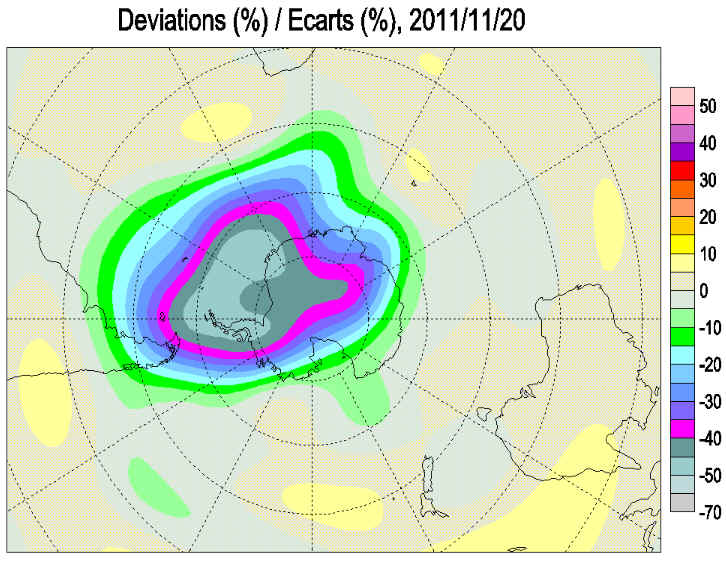
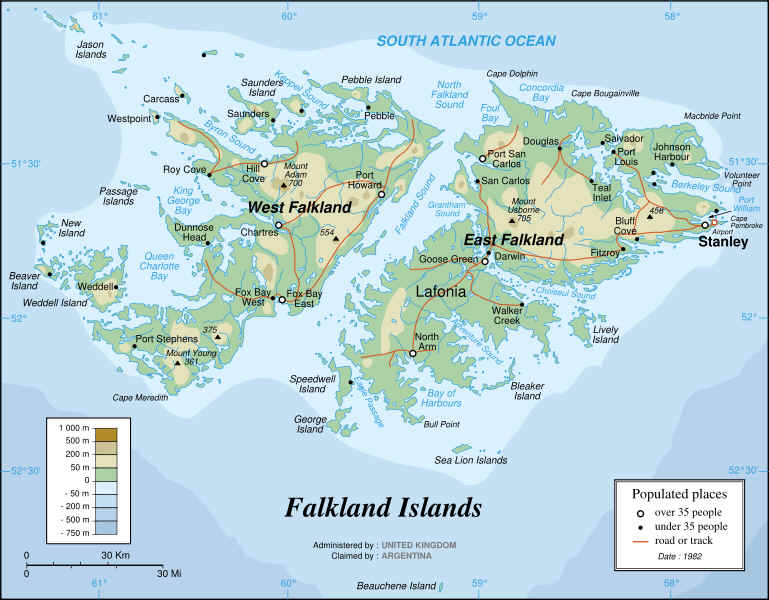
The Ozone hole reached land and population areas in Argentina, Chile and The Falkland Islands on September 25-28 , October 9, 16-19, and November 17-20 2011.
Ozone levels are down as much as 40% in some areas. The protective level of ozone has dropped below 200 dobson units in some areas.
Several hundred thousand people live in the area reached by The Ozone Hole.
The expected high temperatures in the next few days will be in the high 40s(9 centigrade) with cloudy skies, due to its cold and windy climate, people spend a lot of time indoors and are unlikely to venture out with bare arms and legs.
If it becomes sunny the public still should take precautions and avoid going outside during the peak hours of 11:00 a.m. and 3:00 p.m. to avoid exposure to the UV rays. If people do go outside during these hours they should wear protective sunscreen and if possible a hat or head covering and sunglasses with a uv rating.
The ozone layer in the upper atmosphere is the key filter for damaging ultraviolet-B (UV-B) radiation in the Sun's rays. Without it, organisms suffer extensive DNA damage, which in humans results in a greater increase in the risk of skin cancer, eye cataracts and defects in the body's immune system.
T
http://exp-studies.tor.ec.gc.ca/cgi-bin/selectMap?lang=e
At 53 degrees south latitude, Punta Arenas is one of the world's southernmost cities, sitting on the Straits of Magellan only 900 miles from Antarctica.
Population
Maps of deviations represent total ozone deviations from the 1978-1988 level estimated using Total Ozone Mapping Spectrometer (TOMS) data for all areas except the Antarctic and from the pre-1980 level estimated using Dobson data over the Antarctic. Over areas with poor data coverage adjustments are made according to TOMS on Nimbus-7, Meteor-3, ADEOS and Earth Probe satellites. Over the polar night area Dobson and Brewer moon observations and/or NOAA's TIROS Operational Vertical Sounder (TOVS) satellite data are used. TOVS data are also used when the more reliable TOMS data are not available. The mapping algorithm is similar to those used by the WMO Ozone Mapping Centre.
|