Situation at 2005
December 19
British Antarctic Survey Ozone BulletinStratospheric
temperatures rose rapidly in November and the 2005 ozone hole is over.
Generally ozone levels are at their summer maximum. There is, however, still
a small area over the south pole with ozone levels below 250 DU, which is
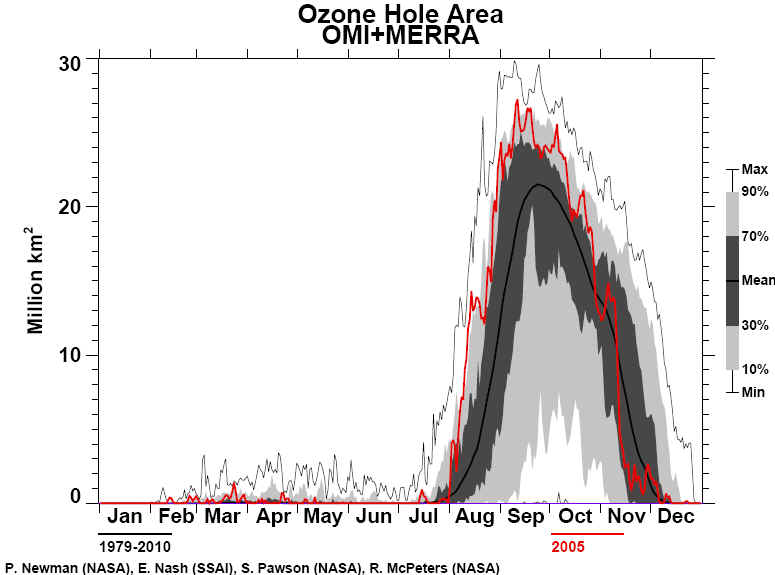
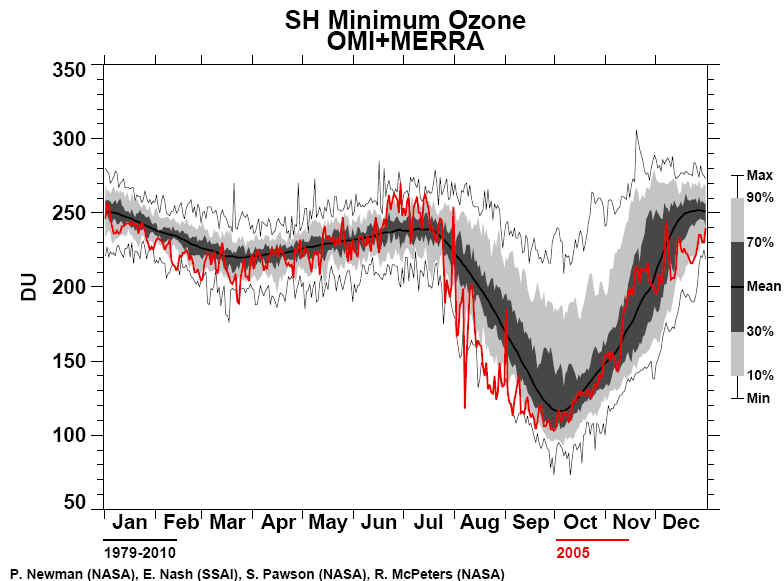
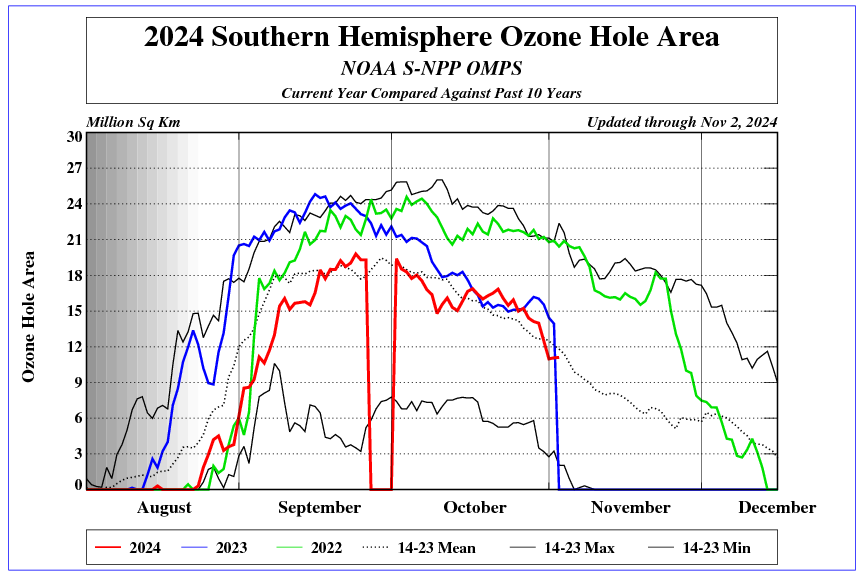
over 30% down on the normal for the time of year. The 2005 ozone hole was
one of the deepest and largest recorded, with a peak of 25 million square
kilometres in early September. Ozone values at Rothera in September were
among the lowest recorded at this time of year, and values around 110 DU
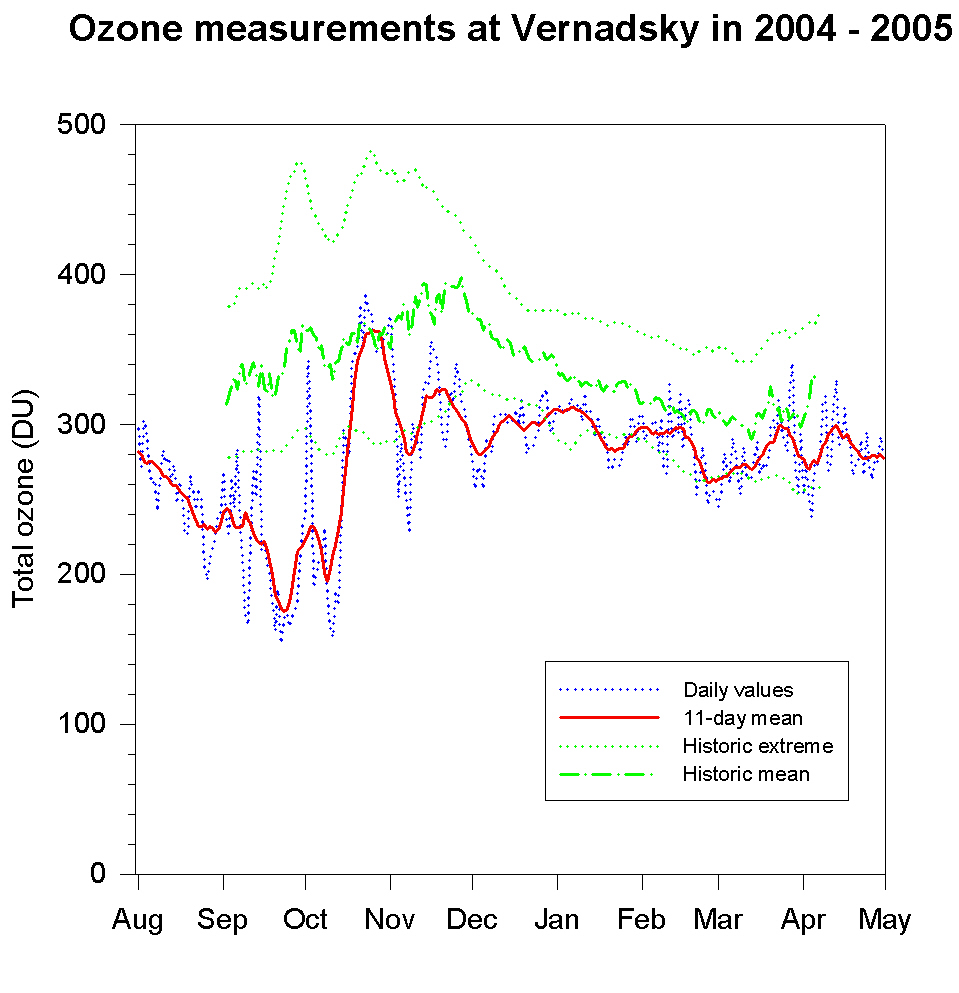
were reached on September 11, 19 and 20. Both Halley and Vernadsky recorded
their second lowest values ever during September. The tip of South America
and the Falkland Islands were affected by the edges of the ozone hole
between August 30 and September 2; September 10 and 12; September 16 and 18;
September 25 and 27. During these periods values dropped to over 20% below
the normal for the time of year, and in the end of September event were over
30% down, with values below 200 DU. The region was affected by severe ozone
depletion from October 7 to 10, when ozone amounts dropped 50% below the
normal levels. South Georgia experienced low ozone values from October 9 to
October 22. The Arctic ozone layer is in its winter state and temperatures
near the top of the ozone layer are cold enough for stratospheric clouds to
form. Ozone amounts over most of the Northern Hemisphere are generally
between 250 and 400 DU. Stratospheric temperatures over the north Atlantic
are below -75°C and ozone values over the northern UK are below 250 DU,
which is approaching 30% below the normal for this time of year. Chemical
ozone depletion is likely to be taking place. Elsewhere ozone values are
generally not far from the normal.
Situation at 2005 October 28-The
2005 ozone hole was one of the deepest and largest recorded. The
atmospheric circulation over the Antarctic continent is now emerging from
its winter state. Stratospheric temperatures are however still cold enough
for stratospheric clouds to exist, although temperatures are rising.
Stratospheric clouds have been observed at Rothera and Vernadsky. There is
still widespread ozone depletion over the continent, with ozone amounts
over 50% down on the normal for the time of year in many places. Lowest
ozone amounts are below 150 DU, though the ozone hole is beginning to
fill. The lowest ozone areas are over the Elsworth Mountains. Overall the
area of the ozone hole is around 13 million square kilometres. It is now
significantly smaller than its peak of 25 million square kilometres in
early September. Ozone values at Rothera in September were among the
lowest recorded at this time of year, and values around 110 DU were
reached on September 11, 19 and 20. The tip of South America and the
Falkland Islands were affected by the edges of the ozone hole between
August 30 and September 2; September 10 and 12; September 16 and 18;
September 25 and 27. During these periods values dropped to over 20% below
the normal for the time of year, and most recently have been over 30%
down, with values below 200 DU. The region was affected by severe ozone
depletion from October 7 to 10, when ozone amounts dropped 50% below the
normal levels. South Georgia experienced low ozone values from October 9
to October 22. Temperatures in the Arctic stratosphere were cold enough
for stratospheric clouds to form until mid March. Very low ozone levels
(230 DU) were recorded over the UK from March 18 to 21. A rapid spring
warming then took place and it is now too warm for such clouds to exist in
the Arctic stratosphere. Ozone amounts over most of the Northern
Hemisphere are generally between 220 and 350 DU. Parts of Siberia are 20%
below the normal, but elsewhere they are generally 5 - 15% below the
normal. Values over the UK are around 300 DU, which is a little above the
normal for this time of year. Generally ozone amounts are declining
towards the normal autumn minimum.
October 18 2005This
year's seasonal ozone hole over Antarctica was the third largest on
record, but forecasters are uncertain how it will behave in the future,
the World Meteorological Organisation (WMO) said Tuesday.
October 13 2005 World
Meteorological Organization-
No 5/2005
Executive summary Since the last WMO Antarctic Ozone Bulletin 14 days ago,
the area where temperatures are below the threshold for formation of PSCs
of type I (nitric acid trihydrate, NAT) has continued to decrease and is
now close to zero. This area has been close to the 2003 values and well
above the 1995-2004 average throughout the month of September and the
first week of October. The area where the total ozone column is less than
220 DU is now on the way down after reaching its maximum around 20
September. Although the ozone hole area has remained nearly constant
during the last two weeks, it is now being filled up with ozone, and
minimum values, as seen by satellites, are now around 125 DU, after being
down to 106 DU on 30 September. Ground-based observations from Belgrano
showed a total ozone column of 94 DU on 4 October, which is the lowest
ever measured at that station. The maximum observed UV index at Antarctic
stations has increased since the previous Bulletin from 4.4 to 6. At
Ushuaia, Argentina, the UV index reached 8 on 8 October, which is
unusually high for this time of the year.
Situation at 2005 October 6-British
Antarctic Survey Ozone Bulletin
The 2005 ozone hole is one of the deepest and largest recorded. The
atmospheric circulation over the Antarctic continent is emerging from its
winter state. Stratospheric temperatures have been cold enough for
stratospheric clouds to form, and although temperatures are rising they
are still widespread. Stratospheric clouds have been observed at Rothera
and Vernadsky. There is widespread ozone depletion over the continent,
with ozone amounts over 50% down on the normal for the time of year in
many places. Lowest ozone amounts are below 100 DU, with all areas of the
edge region below 200 DU, though amounts are beginning to rise. The lowest
ozone areas are near Halley. Overall the area of the ozone hole is around
22 million square kilometres but is a little smaller in size than the 2003
hole, which was one of the largest on record. It is a little smaller than
its peak of 25 million square kilometres in early September. Ozone values
at Rothera in September were among the lowest recorded at this time of
year, and values around 110 DU were reached on September 11, 19 and 20.
The tip of South America and the Falkland Islands were affected by the
edges of the ozone hole between August 30 and September 2; September 10
and 12; September 16 and 18; September 25 and 27. During these periods
values dropped to over 20% below the normal for the time of year, and most
recently have been over 30% down, with values below 200 DU. The region is
likely to be affected by severe ozone depletion from October 8 to 10, when
ozone amounts may drop 50% below the normal levels. South Georgia is
likely to experience low ozone values until October 13.
Situation at 2005 September 23-British
Antarctic Survey Ozone Bulletin
The atmospheric circulation over the Antarctic continent is in its winter
state. Stratospheric temperatures are cold enough for stratospheric clouds
to form and they have been observed at Rothera and Vernadsky. There is
widespread ozone depletion over the continent, with ozone amounts over 50%
down on the normal for the time of year in places. Lowest ozone amounts
are approaching 100 DU, with most areas of the edge region below 200 DU.
The lowest ozone areas are over the base of the Antarctic Peninsula and
the Weddell Sea. Overall the area of the ozone hole is around 22 million
square kilometres but is a little smaller in size than the 2003 hole,
which was one of the largest on record during August. Ozone values at
Rothera are amongst the lowest recorded at this time of year. The tip of
South America and the Falkland Islands was affected by the very edge of
the ozone hole for a few days at the end of August and beginning of
September, when values dropped to over 20% below the normal for the time
of year.The tip of South America was again affected by the edge of the
hole from September 10 to 13. The area is likely to be affected
again around September 22 - 25
30 August 2005
European Space Agency-This season's Antarctic ozone hole has swollen to
an area of ten million square kilometres from mid-August - approximately the
same size as Europe
and still expanding. It is expected to reach maximum extent during September,
and ESA satellites
are vital for monitoring its development.
This year's hole is large for this time of year, based on results from the last
decade: only the ozone
holes of 1996 and 2000 had a larger area at this point in their development.
Envisat's Scanning
Imaging Absorption Spectrometer for Atmospheric Chartography (SCIAMACHY)
routinely monitors
ozone levels on a global basis, continuing a dataset of measurements
stretching back to mid-1995, previously made by the Global Ozone Monitoring
Experiment (GOME) aboard the earlier ESA
spacecraft ERS-2.
ESA data form the basis of an operational near-real time ozone monitoring and
forecasting service forming part of the PROMOTE (PROtocol MOniToring for the
GMES Service Element) consortium,
made up of more than 30 partners from 11 countries, including the Royal Dutch
Meteorological Institute (KNMI).As part of the PROMOTE service, the satellite
results are combined with meteorological data and wind field models so that
robust ozone and ultraviolet forecasts can be made. In a first for ESA,
these results are being used by the World Meteorological Organisation (WMO) to
compile their regularly-updated Antarctic Ozone Bulletin.The precise time and
range of Antarctic ozone hole occurrences are determined by regional
meteorological variations. During the southern hemisphere winter, the
atmospheric mass above the Antarctic continent is kept cut off from exchanges
with mid-latitude air by prevailing winds known as the polar vortex. This leads
to very low temperatures, and in the cold and continuous darkness of
this season, polar stratospheric clouds are formed that contain chlorine.
The stratospheric ozone layer that protects life on Earth from harmful
ultraviolet (UV) radiation is
vulnerable to the presence of certain chemicals in the atmosphere such as
chlorine, originating from man-made pollutants like chlorofluorocarbons (CFCs).
Now banned under the Montreal Protocol, CFCs were once widely used in aerosol
cans and
refrigerators. CFCs themselves are inert, but ultraviolet radiation high in the
atmosphere breaks them down into their constituent parts, which can be highly
reactive with ozone.
As the polar spring arrives, the combination of returning sunlight and the
presence of polar stratospheric clouds leads to splitting of chlorine into
highly ozone-reactive radicals that break ozone down into individual oxygen
molecules. A single molecule of chlorine has the potential to break down
thousands of molecules of ozone.
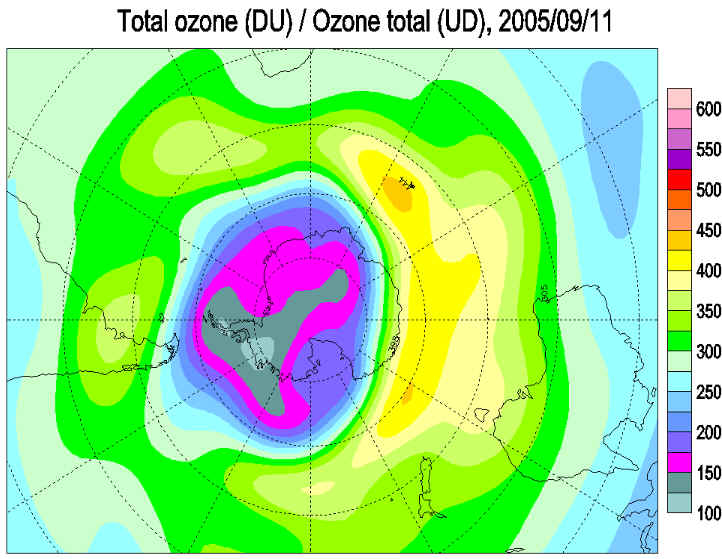
The PROMOTE atmospheric ozone forecast seen here has atmospheric ozone measured
in Dobson Units (DUs), which stands for the total thickness of ozone in a given
vertical column if it were
concentrated into a single slab at standard temperature and atmospheric pressure
– 400 DUs is equivalent to a thickness of four millimetres, for example.
Developing out of the successful precursor Tropospheric Emission Monitoring
Information Service (TEMIS), PROMOTE is a portfolio of information services
covering the atmosphere part of the Earth System, operating as part of ESA's
initial Services Element of Global Monitoring for Environment and Security
(GMES). This is a joint initiative between ESA and the European Commission to
combine all available ground- and space-based information sources and develop a
global environmental monitoring capability for Europe.
August 22 2005 World
Meteorological Organization-
From May to mid-August the meteorological conditions in the Antarctic
stratosphere were close to the 1995-2004 average, colder than 2004, but a little
warmer than in 2003.The total ozone column along the edge of the Antarctic air
mass (vortex) is significantly smaller than at the same time in 2004 and also
somewhat smaller than in 2003, when the largest ozone hole on record occurred.
It is still too early in the season to give a reliable statement about the size
and depth of this year's Antarctic ozone hole. WMO, in collaboration with the
ozone science community, is using ozone observations and meteorological data to
keep a close eye on the development during the coming weeks and months.
Most of Antarctica still remains under winter darkness, so the average rate of
ozone loss there remains relatively low. However, total ozone column maps
synthesised by the World Ozone and UV Data Centre at Environment Canada, using
surface-based WMO/GAW network observations and satellite data, show that the
sunlit parts of the vortex in mid-August have total ozone column values well
below 200 DU and even close to 150 DU along the vortex edge, and in particular
in the regions around the Antarctic Peninsula.
This is considerably lower than at the same time in 2004 when the lowest ozone
column was around
240 DU and also somewhat lower than in mid-August 2003. This result has been
confirmed by independent analyses and forecasts carried out by the Royal
Netherlands Meteorological Institute
Temperatures are still sufficiently low within the polar vortex to maintain the
chemical processes
required for the formation of the annually recurring Antarctic ozone hole The
ozone hole usually
does not reach its maximum size until mid- to late September, but already by
mid-August, one
can see the first signs of ozone destruction. As the sun rises over Antarctica
during the coming
weeks, the ozone hole is expected to deepen. The amount of ozone loss will be
dependent upon prevailing meteorological conditions in the stratosphere,
particularly during September and October. This situation is expectedto continue
as long as the stratosphere contains an excess of ozone depleting substances. In
August, ozone loss is limited and the sun is still low in the sky, so the
intensity of ultraviolet (UV) radiation in areas usually affected by the ozone
hole is modest. UV levels will be reported in future ozone bulletins.
Situation at 2005 June 20-British
Antarctic Survey Ozone Bulletin
The
atmospheric circulation over the Antarctic continent is in its early winter
state. The ozone layer over much of the Southern Hemisphere south of 50°
is 10 - 15% below the long term normal. Ozone values are below 230 DU over
parts of Antarctica. Stratospheric temperatures are now cold enough for
stratospheric clouds to begin forming.
Information about the 2004 ozone hole is in the
archive report for 2004/5.
Temperatures in the Arctic stratosphere were cold enough for stratospheric
clouds to form until mid March. A rapid spring warming then took place and
it is now too warm for such clouds to exist in the Arctic stratosphere.
Ozone amounts over parts of the Northern Hemisphere are over 15% below the
normal, but all areas have ozone levels above 300 DU. Although values over
the UK are around 300 DU, this is 10% below the normal for this time of year,
hence there is a high risk of sun-burn. Values are expected to remain
below normal for the next few days. Very low ozone levels (230 DU) were recorded
over the UK from March 18 to 21.
Note:
The Antarctic ozone hole is usually largest in early September and deepest in
late September to early October. September 16 is world ozone day.
Prior to the formation of ozone holes, Antarctic ozone values were normally at
their lowest in the autumn (ie March).
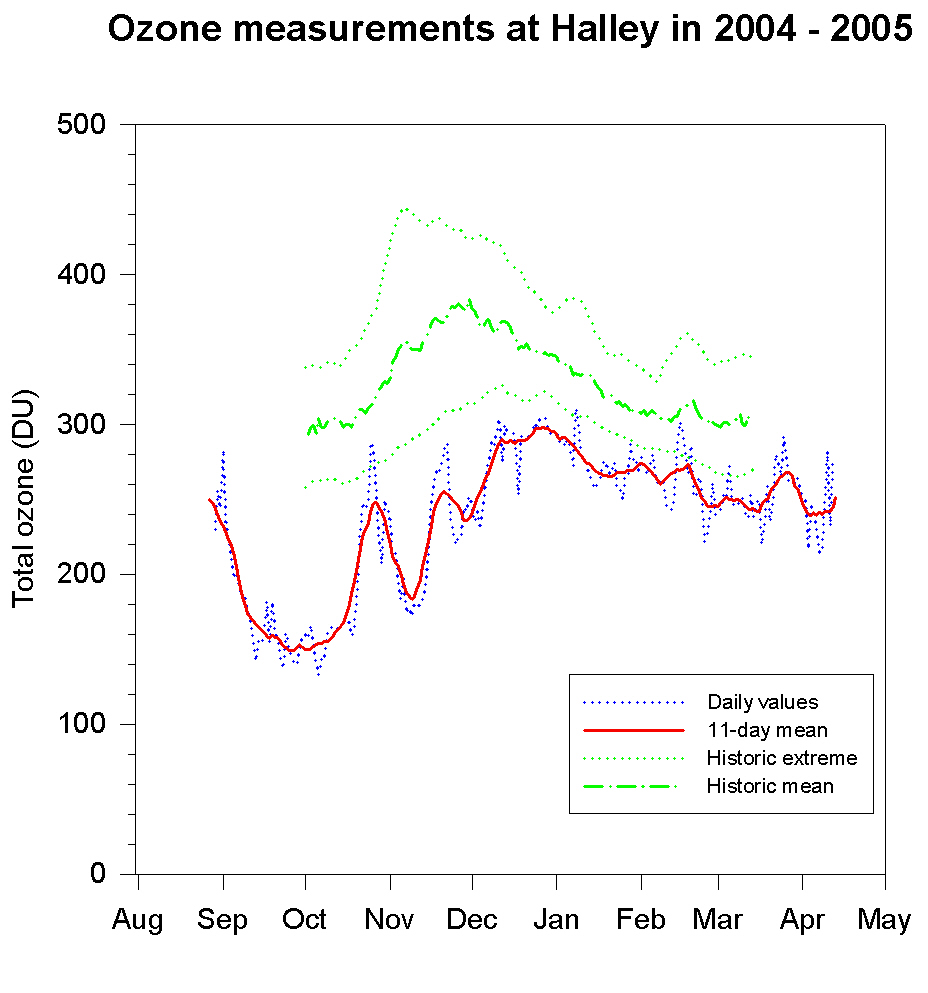
Halley - Total ozone: The 2005 observing season will start
in late August. This
figure
[updated 2005 April 20] shows the variation in 2004 - 2005 and the normal for
1957-72.
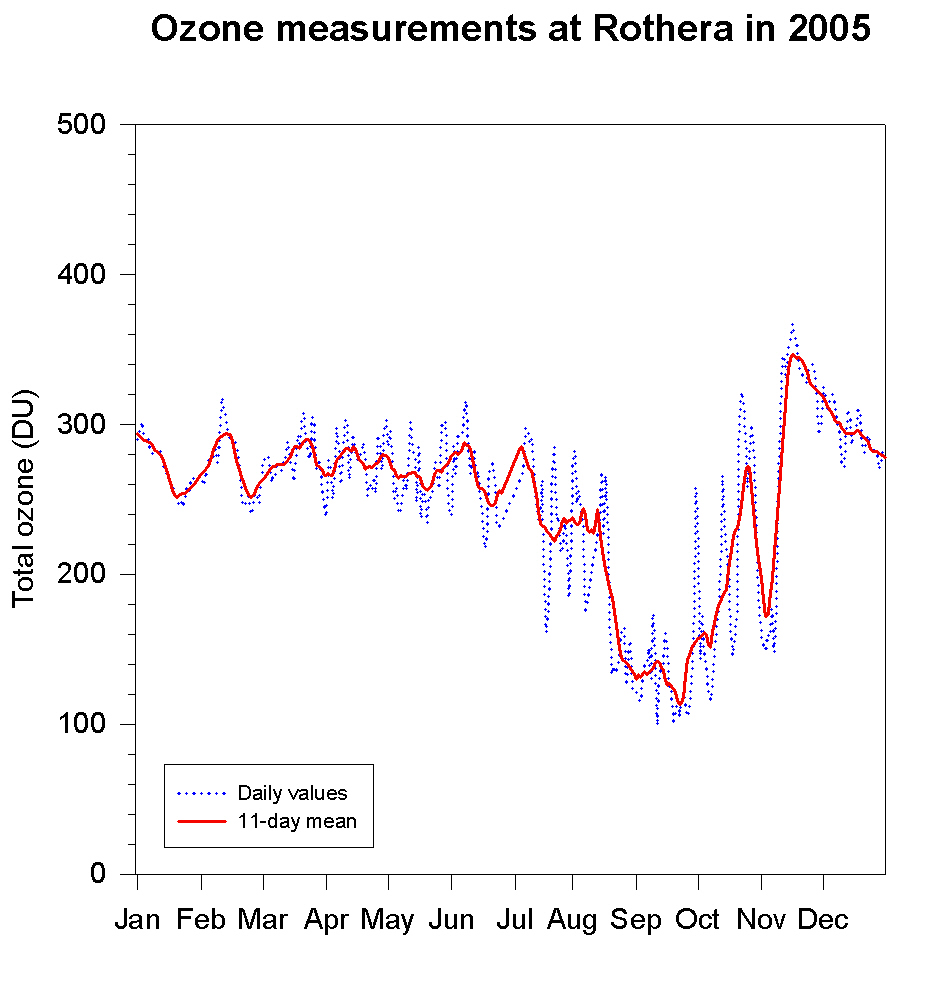
Rothera - Total ozone: Mean values in 2005
fell slowly from 285 DU at the beginning of the year to 260 DU at the winter
solstice, with long period variation of around 20 DU from the mean, and
shorter period variation of 30 DU. This
figure
[updated 2005 June 28] shows the variation during the year.
Vernadsky - Total ozone: The 2005 observing season will start
in July. This
figure
[updated 2005 June 10] shows the variation in 2004 - 2005 and the normal for
1957-72.
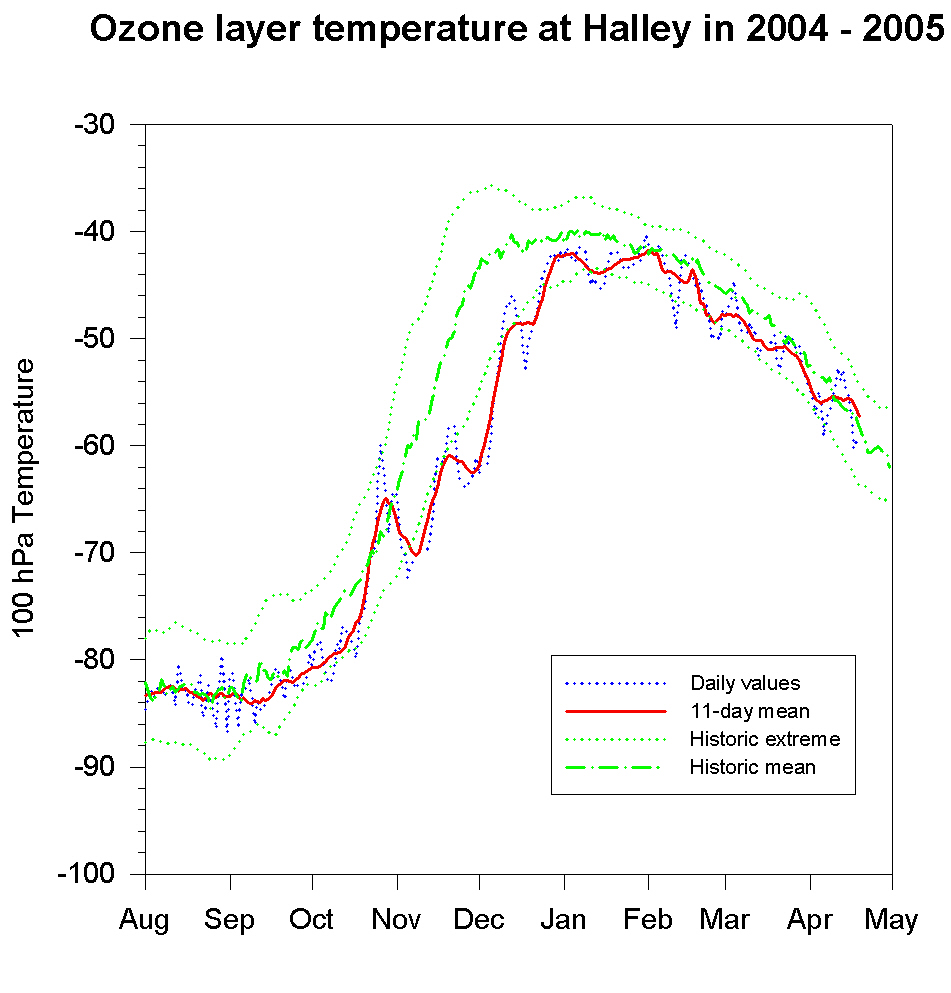
Temperature and PSCs:
The 100 hPa pressure level is near the base of the ozone layer, but is reached
by most radiosonde flights. The temperature at this height
becomes sufficiently cold that polar stratospheric clouds (PSCs) can exist
widely during the winter.
Halley - 100 hPa temperature: The temperature is at winter
values of -80°C. This
figure
[updated 2005 April 20] shows the variation at Halley in 2004 - 2005 and the
normal for 1957-72.
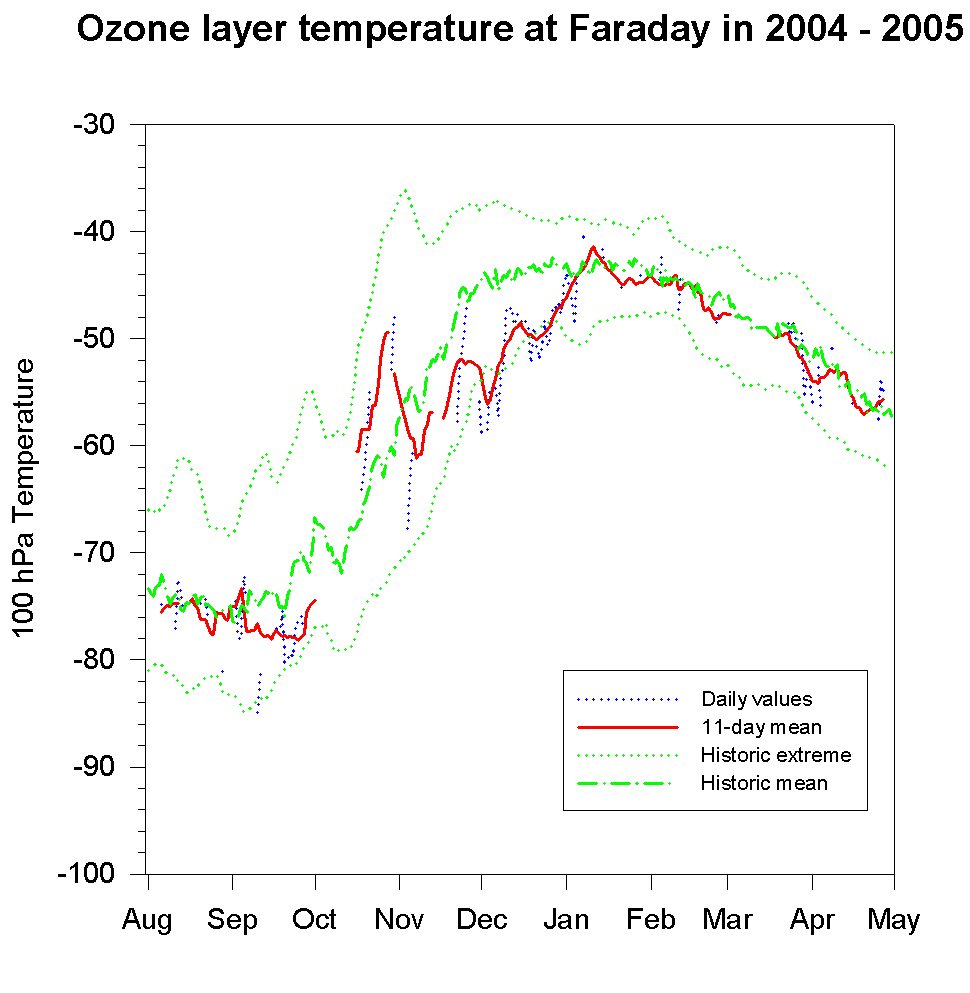
Peninsula - 100 hPa temperature: Since the beginning of January
the 100 hPa temperature has been close to the long term normal. This
figure
[updated 2005 June 10] (compiled from flights from Marambio, Rothera and the
Polarstern) shows the variation in 2004 - 2005 and the normal for 1957-72.
There has been a radiosonde programme of several flights per week at Rothera
since 2003 March, increasing to daily flights for the QUOBI project from mid
June to mid October 2003. Strong winds on 2004 October 2 & 3 damaged the hangar
at Rothera and this has significantly restricted the conditions under which
sondes can be launched. The Polarstern was stationed in the western
Weddell Sea from early December 2004 to early January 2005 and launched one or
two sondes each day.
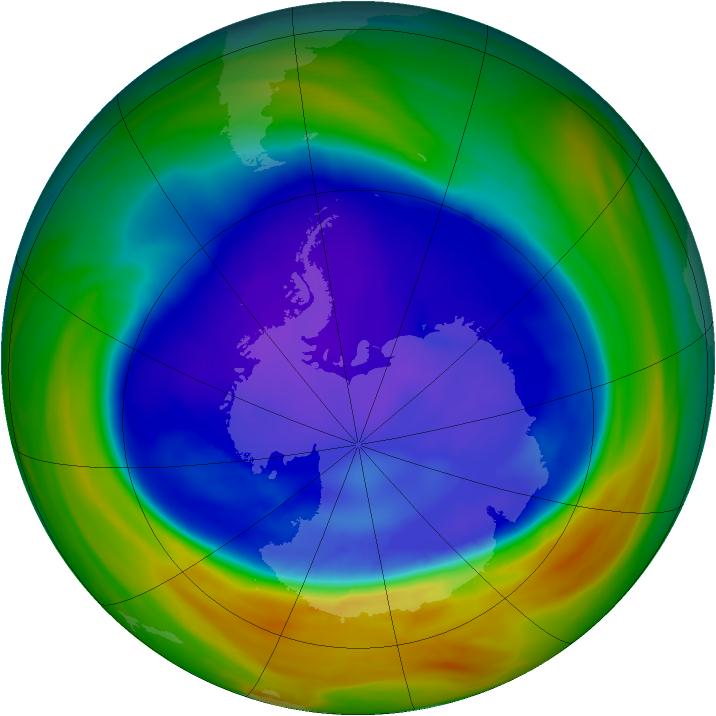
Satellite:
Satellite imagery gives a global perspective on the ozone hole. TOVS (which
can image during the polar night) and TOMS currently have significantly
different calibrations, with TOVS showing lower readings than TOMS. TOMS
values are close to ground-based values. Different satellite operators use
slightly different criteria for defining the area of the ozone hole and hence
give slightly different areas. Our
2004/2005
Antarctic ozone hole movie [updated 2005 June 28] is produced from TOMS images.
The NCEP and KNMI analyses shown on the
Canadian Met Service daily ozone maps pages give a good analysis in the
Southern Hemisphere but the NCEP forecasts tend to increase ozone amounts within
the ozone hole. US NWS
CPC plots from NOAA show the
current area of the ozone hole.
Arctic: Ozone values over the Arctic since June are shown in our
Northern Hemisphere TOMS movie. Ozone values declined from the spring
maximum in northern temperate and polar regions reaching the normal autumn
minimum in early October. The lowest ever UK reading from Lerwick was
recorded on 2004 October 31. Ozone values dropped below 200 DU over parts
of the Arctic in early December. Winter temperatures in the stratosphere
were significantly colder than normal allowing extensive formation of
stratospheric clouds. This led to substantial ozone depletion, at times
over 40%. Very low ozone values, around 230 DU, were recorded over the UK
between March 18 and 21. Ozone values over the northern hemisphere are now
at summer levels between 300 and 420 DU. For more UK information see
the DEFRA UK
Stratospheric Ozone Measurements page.
Reports of
a substantial Arctic ozone hole forming in response to a solar proton event in
the spring of 2004 are somewhat exaggerated. Although this did lead to
substantial depletion of up to 60% near the top of the ozone layer, less than
10% of the total ozone column is in this region. The event therefore had
less effect than normal day to day changes and no ozone hole was formed.
The spring of 2005 by contrast had much lower stratospheric temperatures and
significant chemical ozone depletion did take place. Although the column
ozone never quite dropped to "ozone hole" levels, the amount of ozone affected
by chemical depletion is broadly comparable to that seen in the Antarctic ozone
hole.
Equator: Ozone levels are normally lowest over the topics and TOMS data
shows nothing unusual. TOVS data has a calibration problem and shows values that
are significantly lower than those that are measured by other means.
|


