|
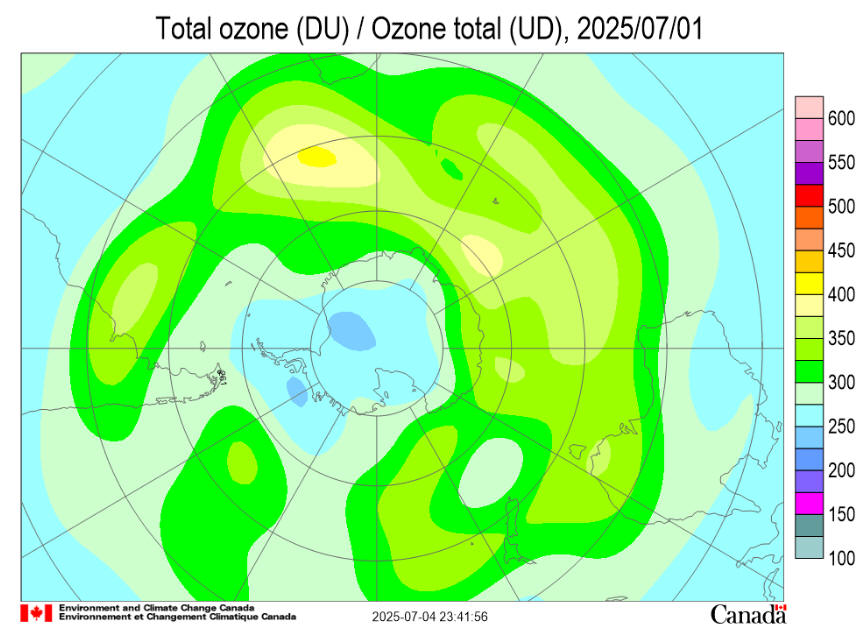
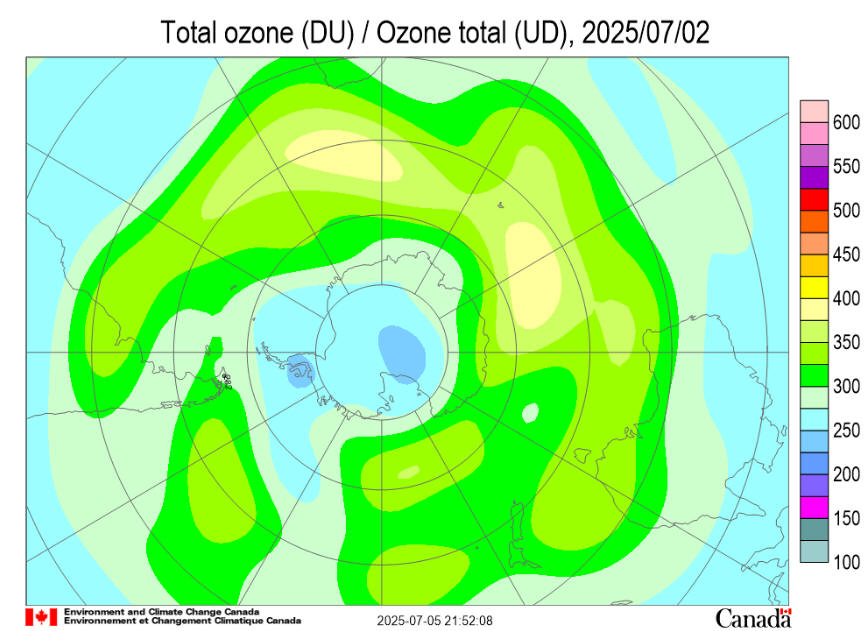
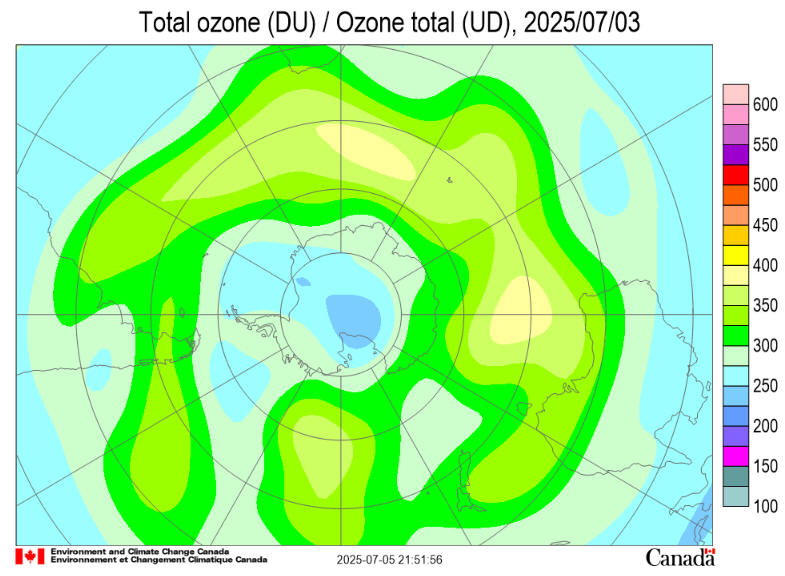
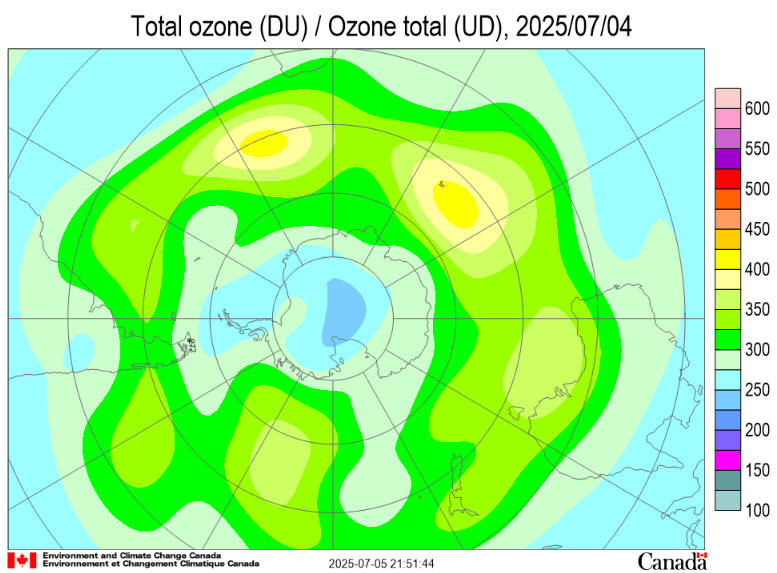
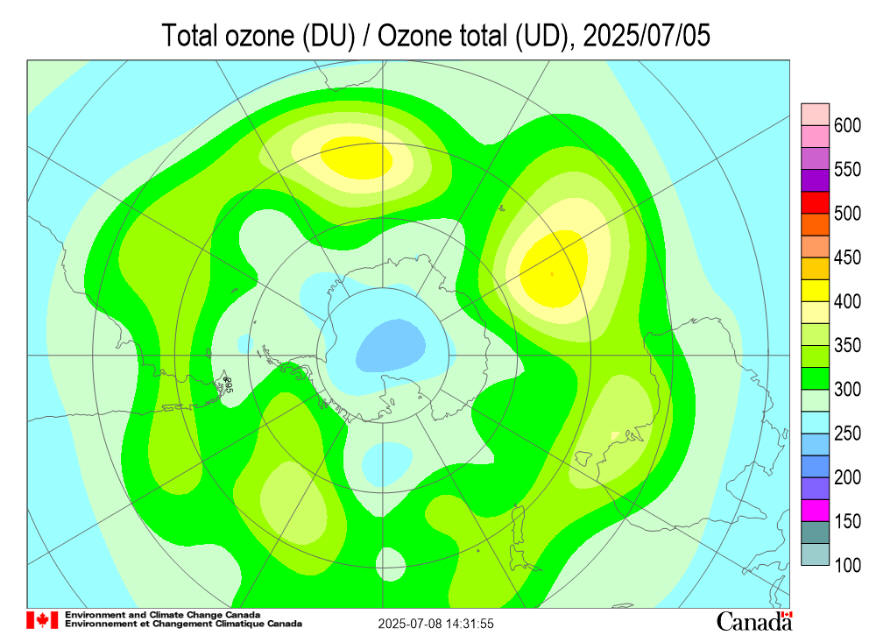
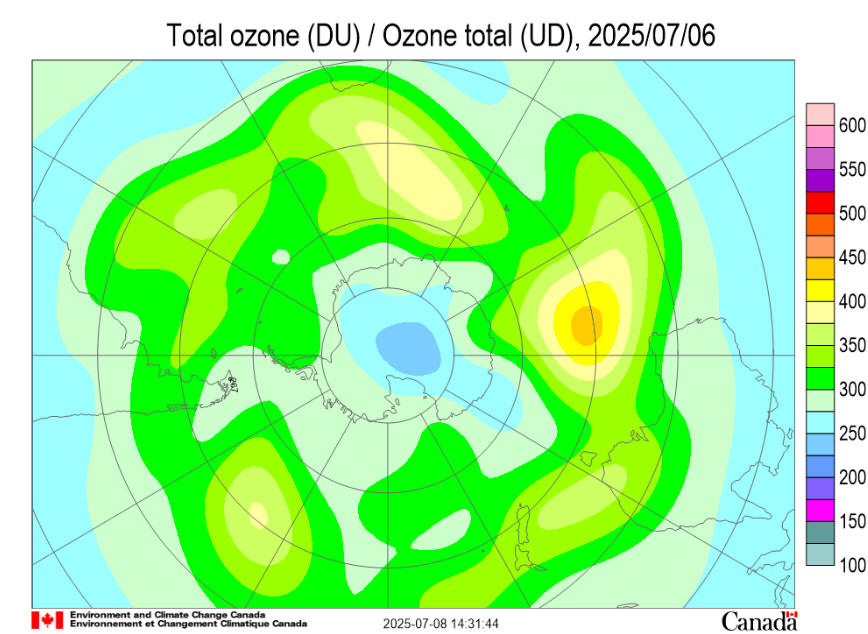
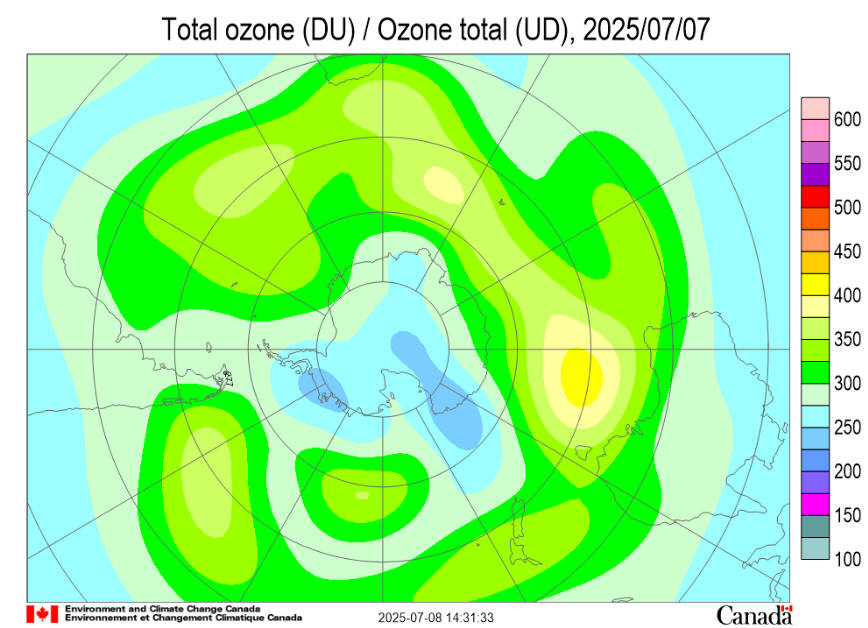
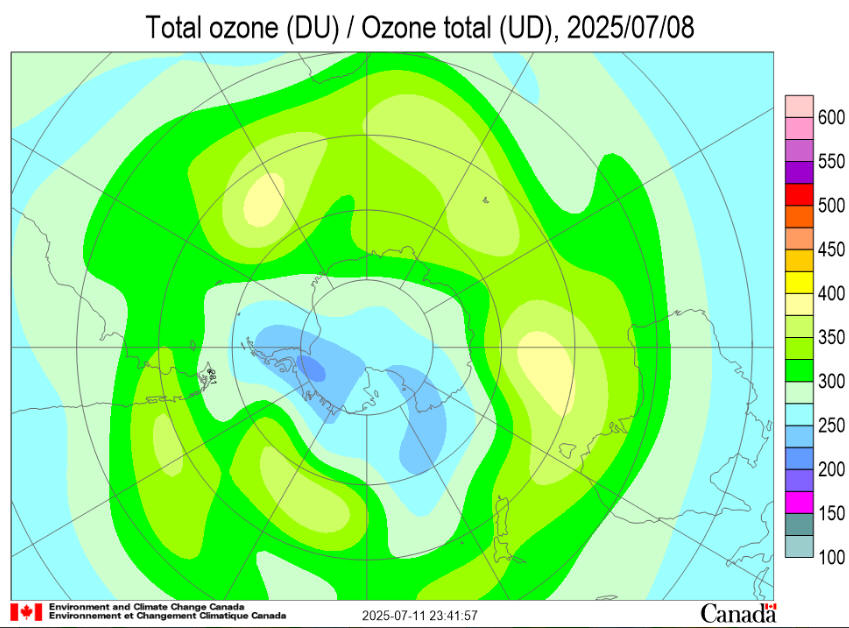
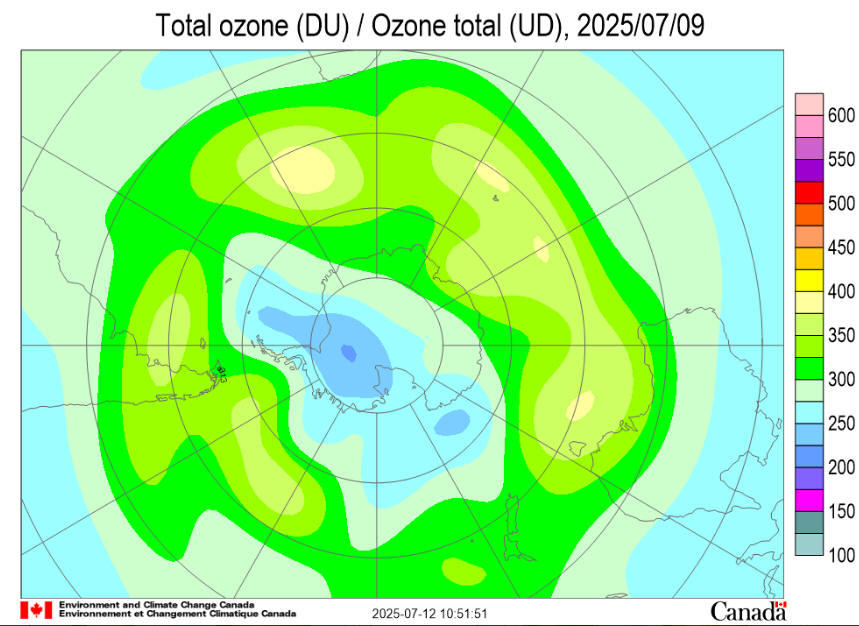
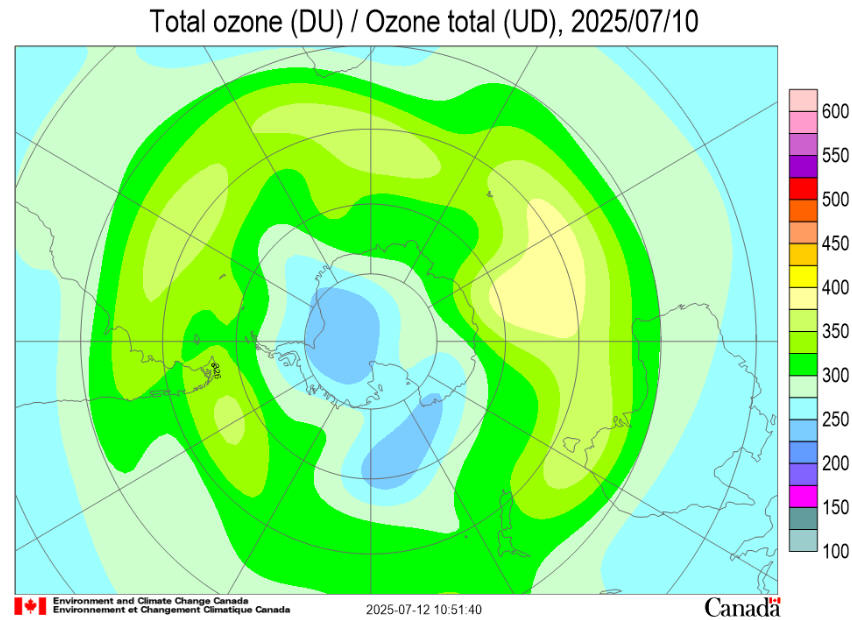
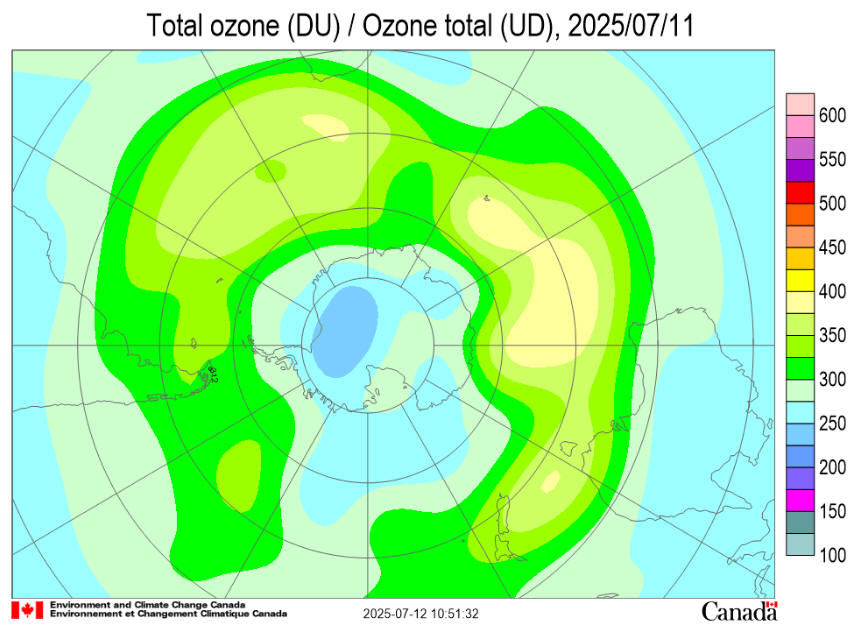
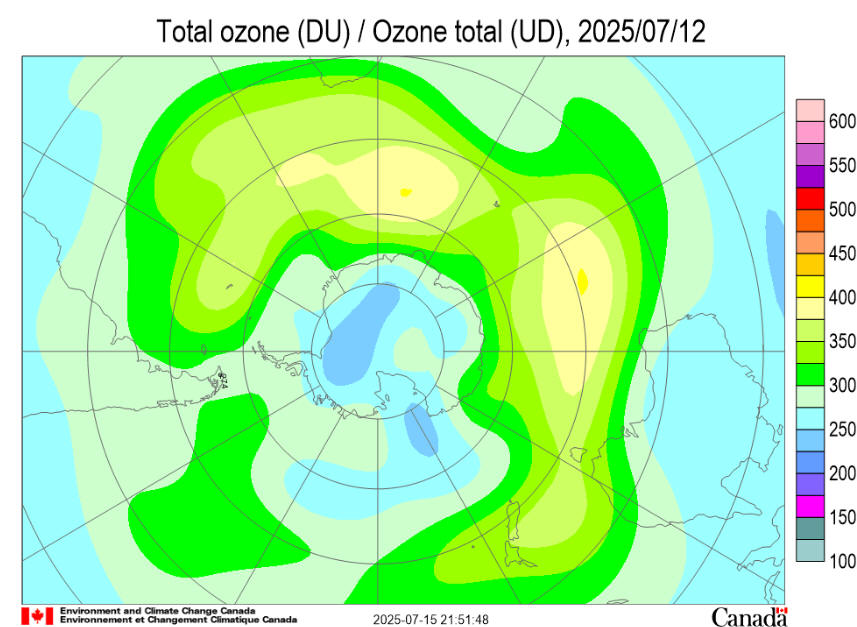
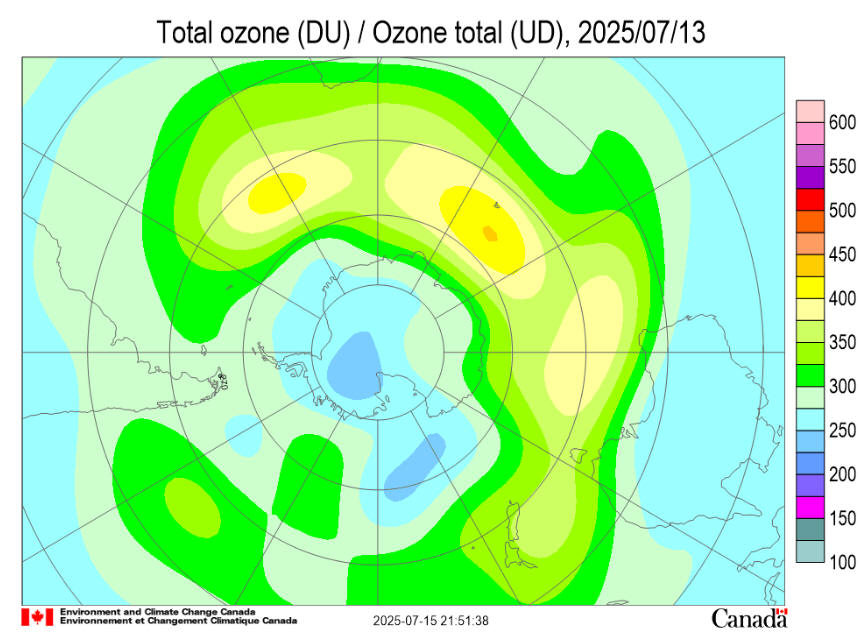
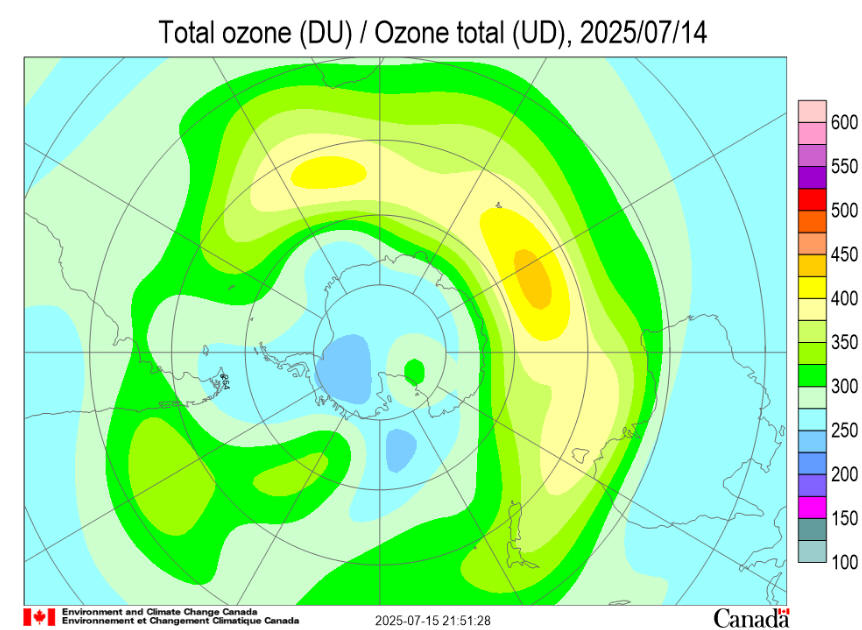
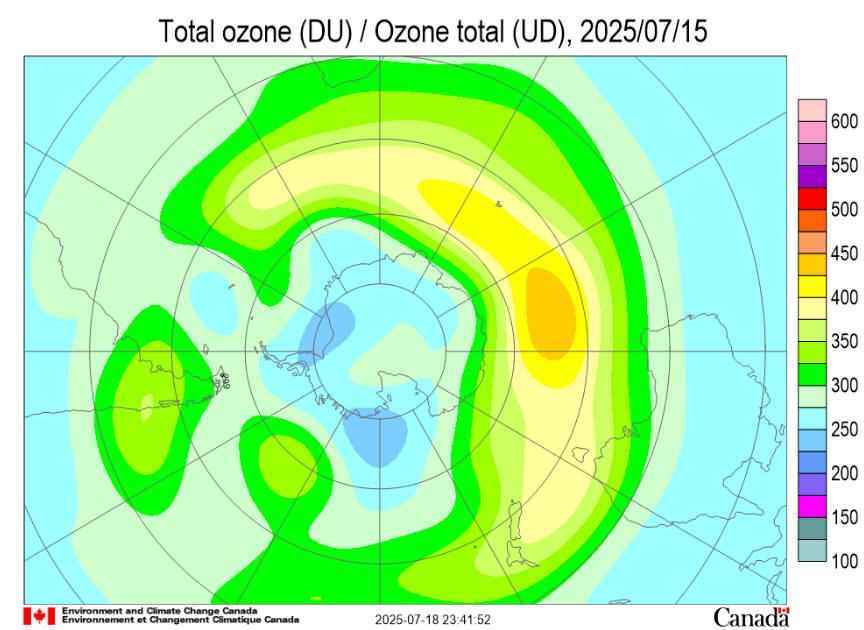
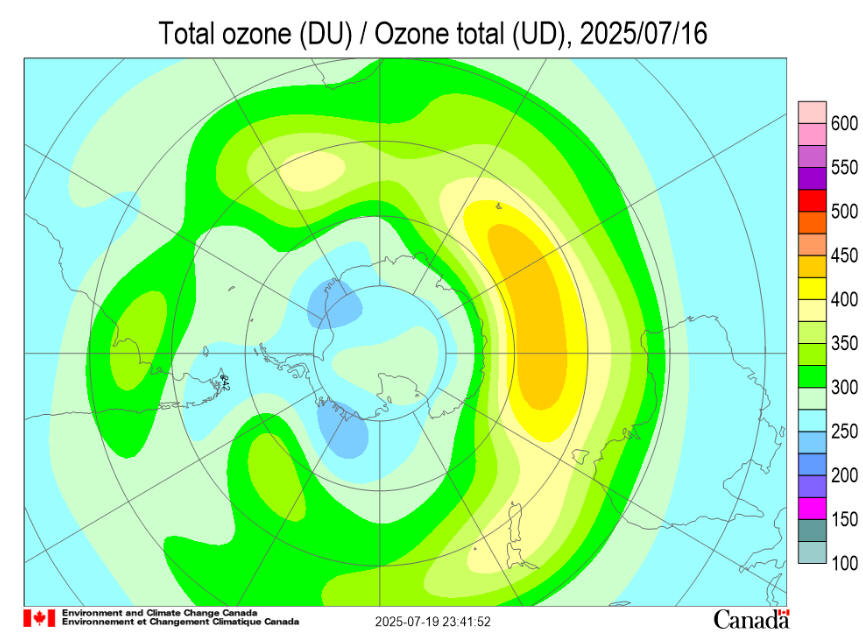
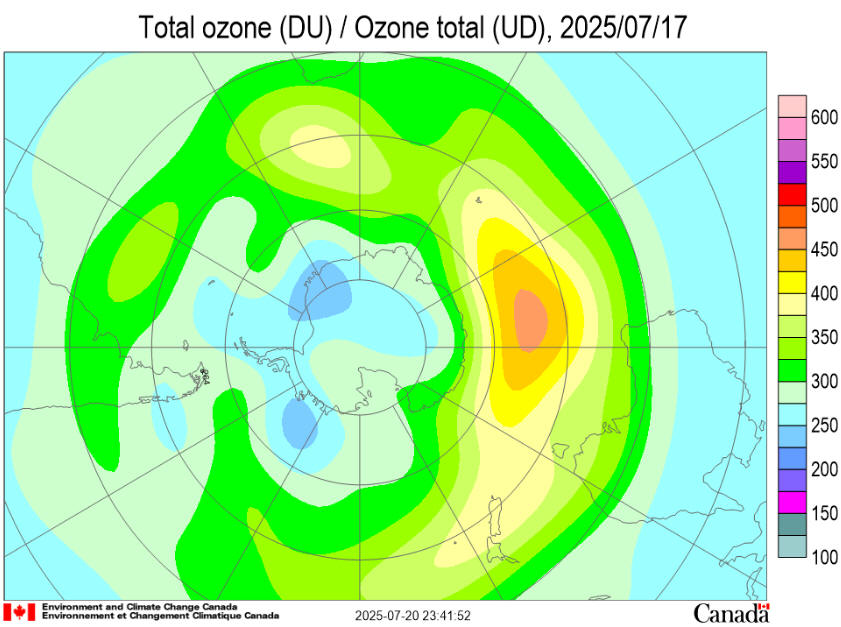
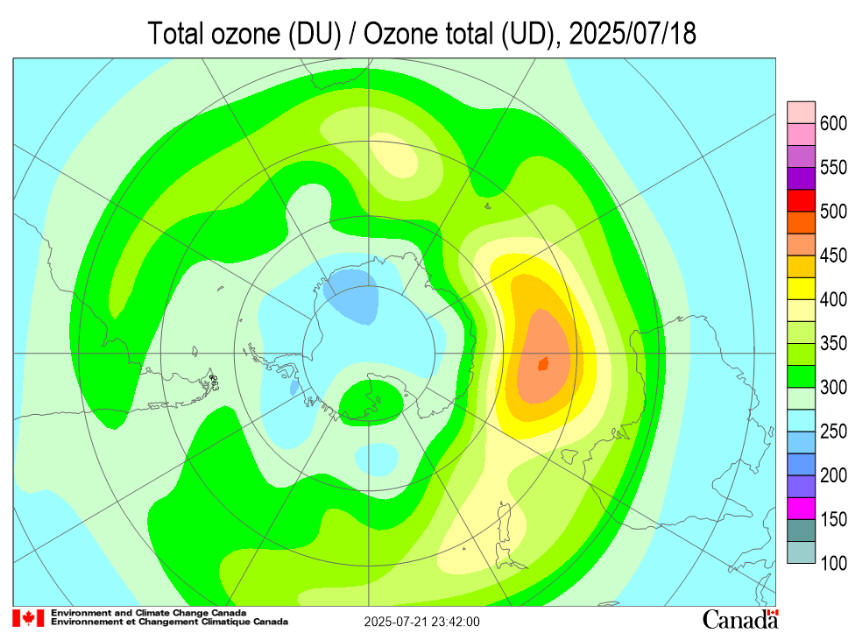
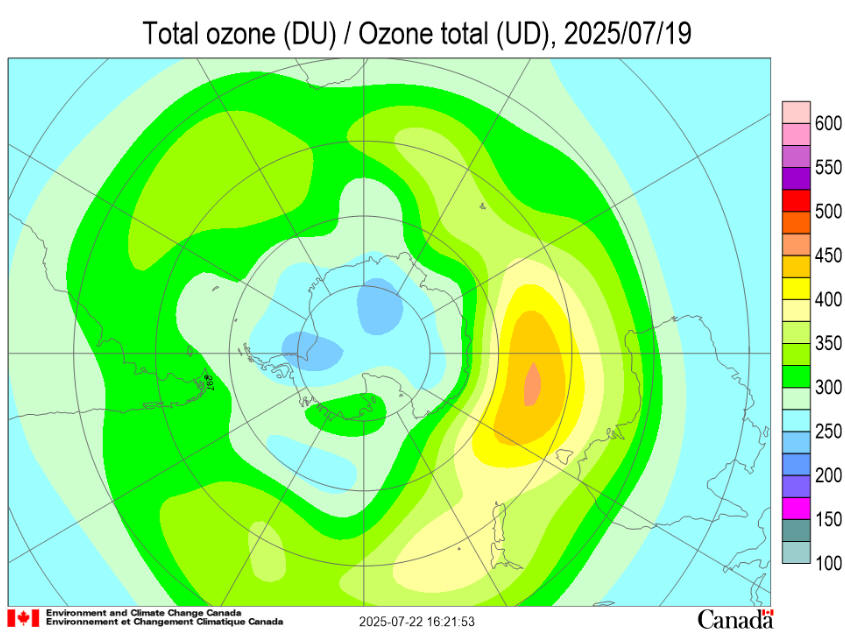
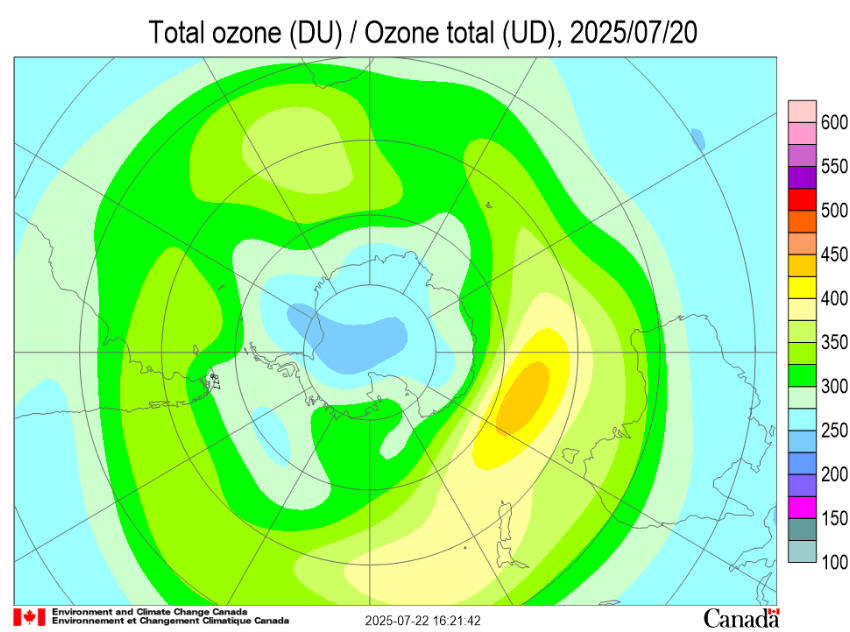
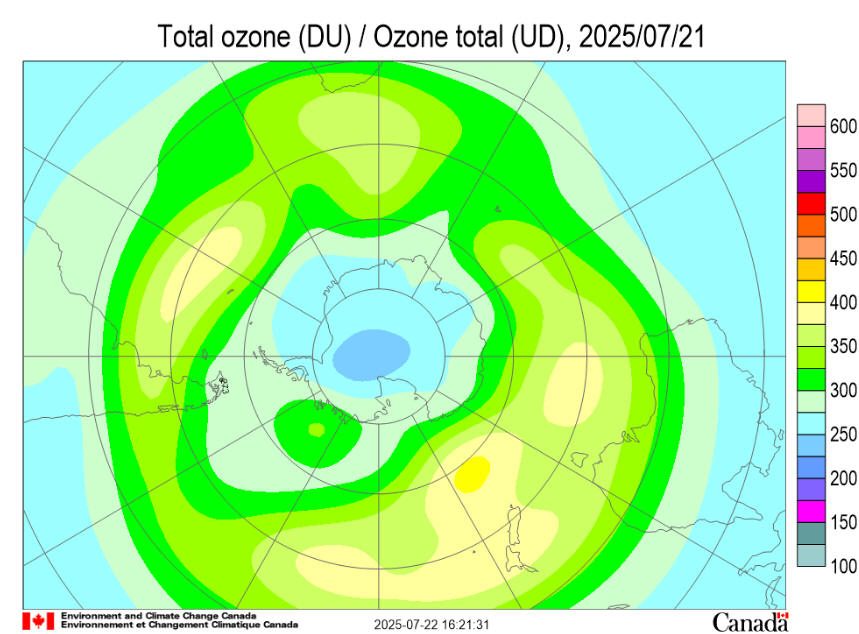
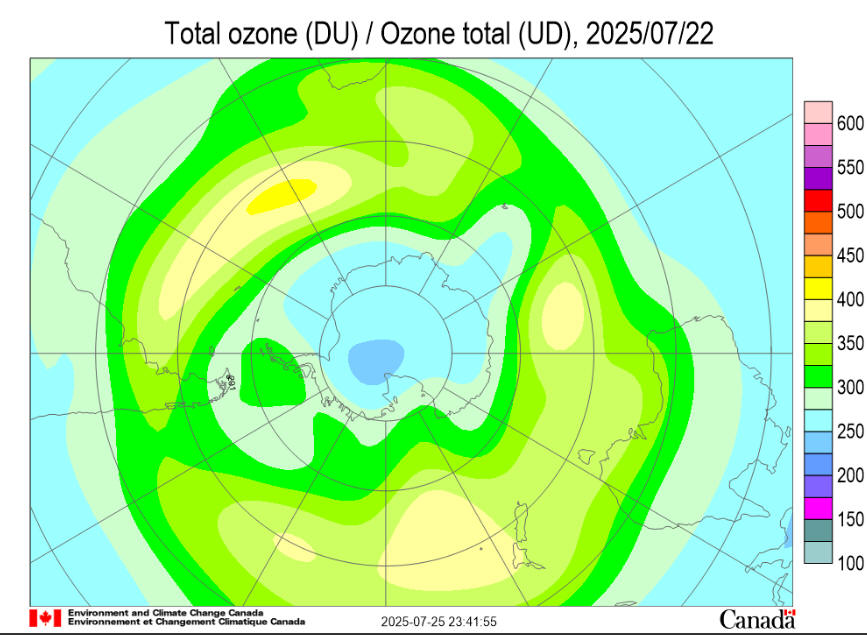
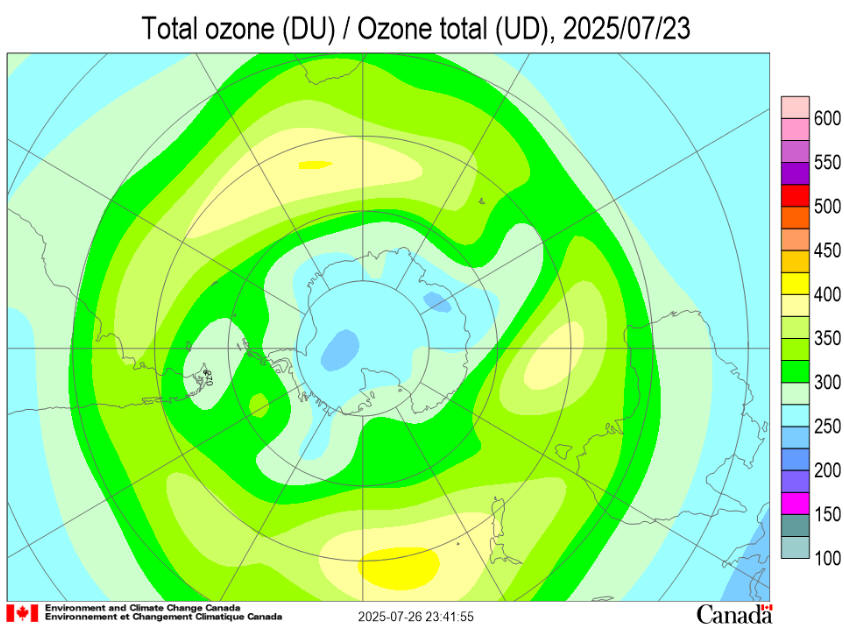
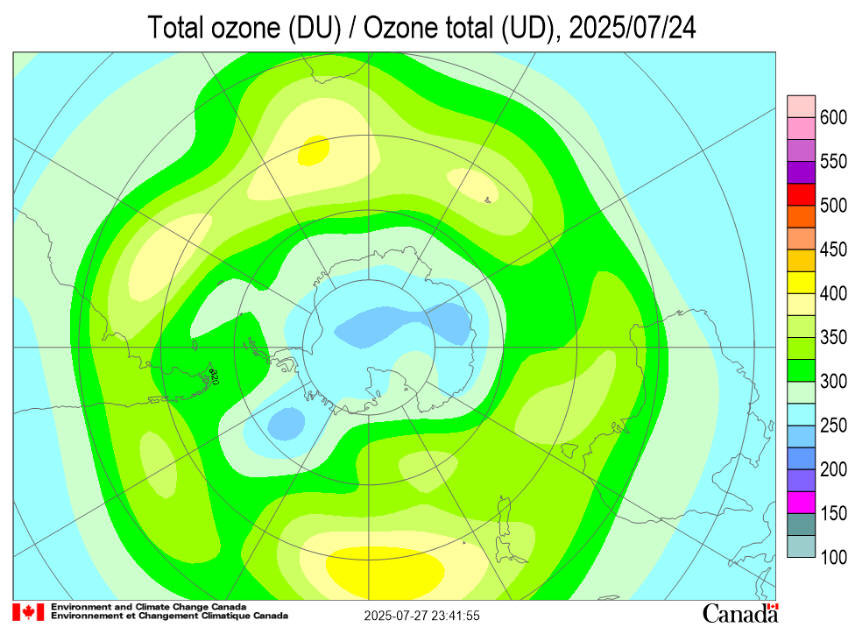
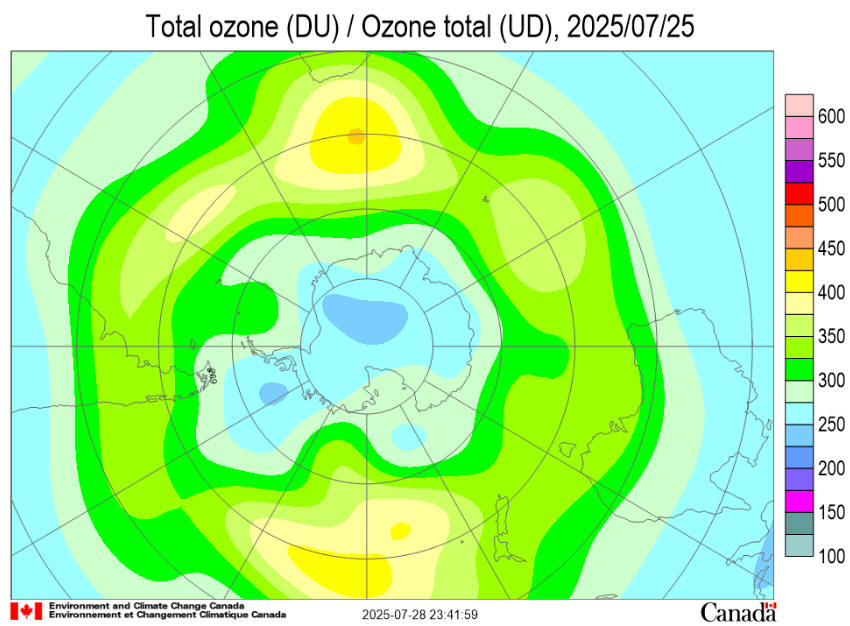
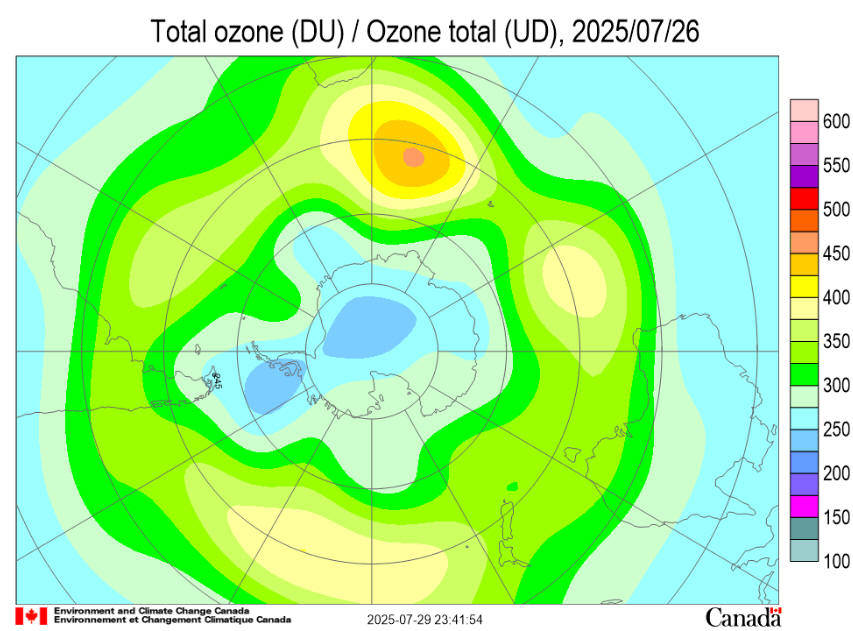
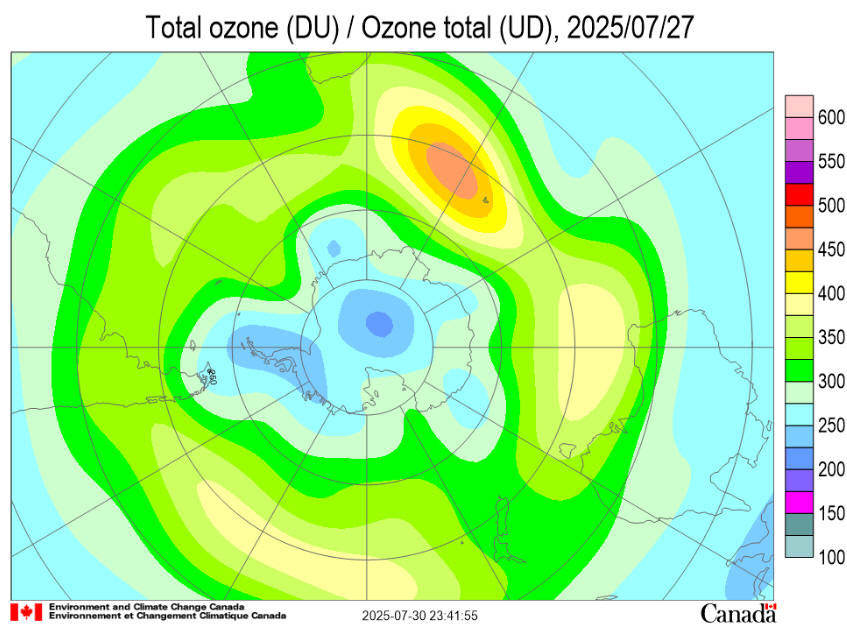
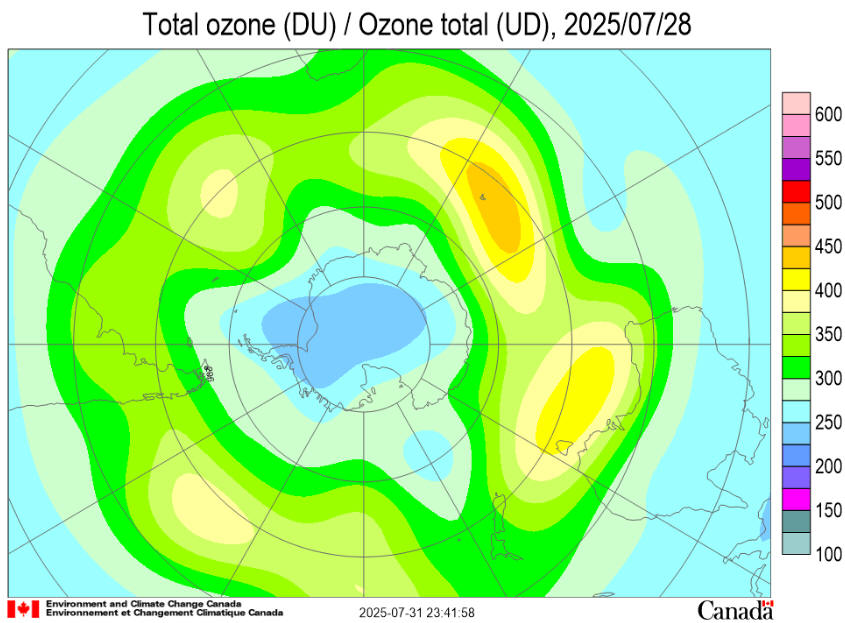
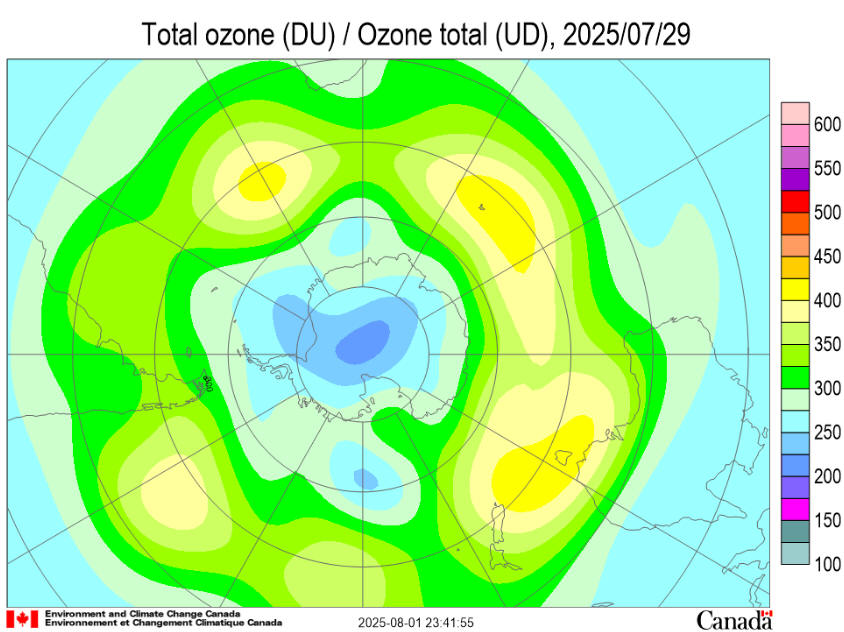
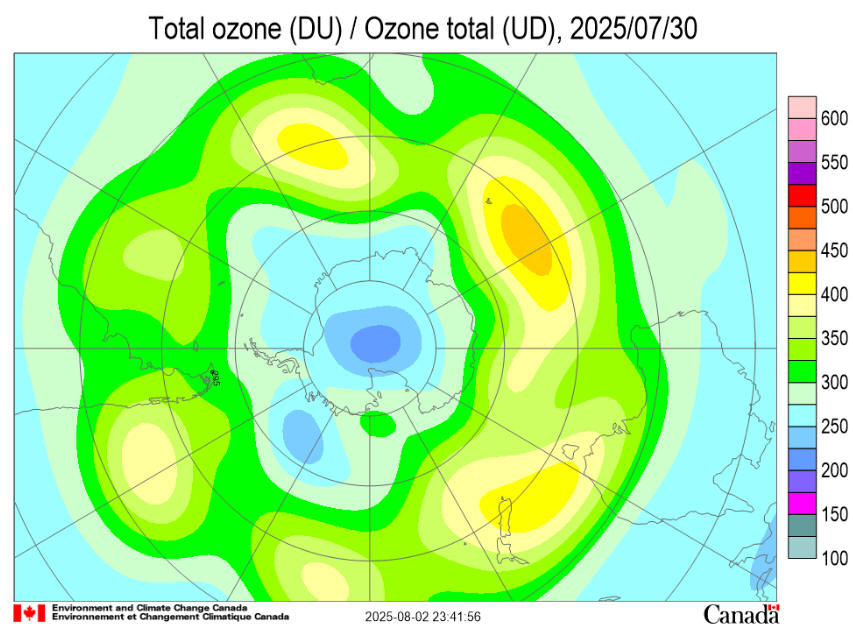
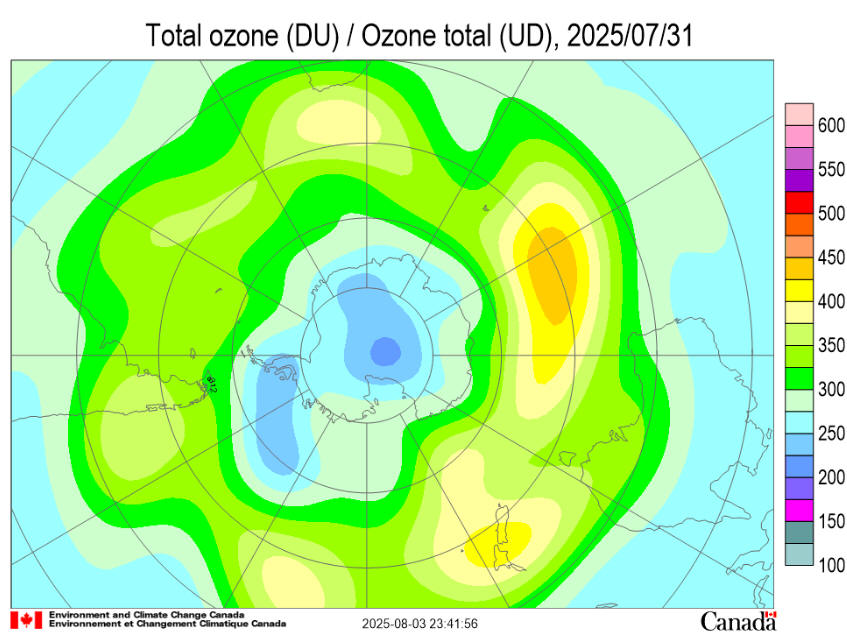
Ozone Hole July 2025
The total ozone maps are based on ground-based measurements available from the World Ozone and Ultraviolet Radiation Data Centre. Preliminary near real-time data from ground-based observations were also used for the most recent maps. Total ozone values are given in Dobson Units. The numbers represent observations taken from ground stations situated at the bottom left corner of the number. The World Ozone and Ultraviolet Radiation Data Centre (WOUDC) is one of six World Data Centres which are part of the Global Atmosphere Watch programme of the World Meteorological Organization. The WOUDC data centre is operated by the Meteorological Service of Canada, a branch of Environment and Climate Change Canada. Ozone data set categories include total column ozone and vertical profile data from lidar measurements, ozonesonde flights, and the Umkehr technique. Ultraviolet (UV) radiation data set categories include broadband, multiband, and high resolution spectral data types. Maps of deviations represent total ozone deviations from the 1978-1988 level estimated using Total Ozone Mapping Spectrometer (TOMS) data for all areas except the Antarctic and from the pre-1980 level estimated using Dobson data over the Antarctic. Over areas with poor data coverage adjustments are made according to TOMS on Nimbus-7, Meteor-3, ADEOS and Earth Probe satellites. Over the polar night area Dobson and Brewer moon observations and/or NOAA's TIROS Operational Vertical Sounder (TOVS) satellite data are used. TOVS data are also used when the more reliable TOMS data are not available. The mapping algorithm is similar to those used by the WMO Ozone Mapping Centre. |