
|
Ozone Hole History
As mid-May brings on the onset of winter, the Antarctic stratosphere cools and descends closer to the surface. The Coriolis effect (caused by the earths rotation) sets up a strong westerly circulation around the south pole, forming an oblong vortex which varies in size from year to year.
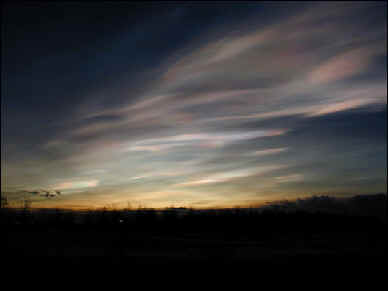
Polar Stratospheric Clouds Lamont Poole, NASA Langley Research Center As temperatures in the lower stratosphere cools below -80'C, Polar Stratospheric Clouds (PSC's) start to form. In the area over Antarctica, there are stratospheric cloud ice particles that are not present at warmer latitudes. Reactions occur on the surface of the ice particles that accelerate the ozone destruction caused by stratospheric chlorine. Polar regions get a much larger variation in sunlight than anywhere else, and during the 3 months of winter spend most of time in the dark without solar radiation. Temperatures hover around or below -80'C for much of the winter and the extremely low Antarctic temperatures cause cloud formation in the relatively ''dry'' stratosphere. These Polar Stratospheric Clouds (PSC's) are composed of ice crystals that provide the surface for a multitude of reactions, many of which speed the degradation of ozone molecules. This phenomenon has caused documented decreases in ozone concentrations over Antarctica. In fact, ozone levels drop so low in spring in the Southern Hemisphere that scientists have observed what they call a "hole" in the ozone layer. The ozone destruction process requires conditions cold enough for stratospheric clouds to form. Once these stratospheric clouds form the process can take place, even in warmer conditions.
Jonathan Shanklin of The BAS making ozone measurements © British Antarctic Survey
Ground based measurements of Ozone were first started in 1956, in at Halley Bay, Antarctica. Satellite measurements of ozone started in the early 70's, but the first comprehensive worldwide measurements started in 1978 with the Nimbus-7 satellite. Chloroflourocarbons were first created in 1928 as non-toxic, non-flamable refrigerants, and were first produced commercially in the 1930's by DuPont. The first Chlorofluorocarbon was CFC-12, a single carbon with two chlorines and two Fluorines attached to it. In 1974 M.J.Molina and F.S.Rowland published a laboratory study demonstrating the ability of CFC's to catalytically breakdown Ozone in the presence of high frequency UV light. Further studies estimated that the ozone layer would be depleted by CFC's by about 7% within 60yrs and based on such studies the US banned CFC's in aerosol sprays in 1978. Slowly various nations agreed to ban CFC's in aerosols but industry fought the banning of valuable CFC's in other applications.
Dr. Shigeru Chubachi, Meteorological Research Institute, Japan, measures low ozone and an ozone hole over Syowa, Antarctica (reported at Ozone Commission meeting in Halkidiki, Greece in Sept 1984)
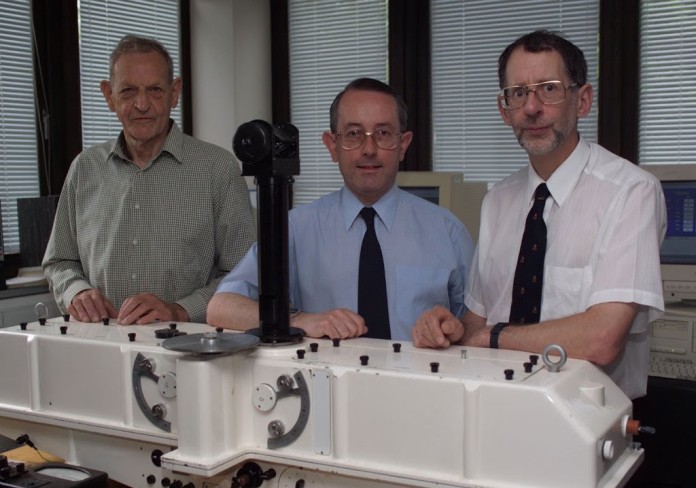
Joesph Farman, Brian Gardiner, and Jonathan Shanklin of the British Antarctic Survey
In 1984 British Antarctic Survey scientists, Joesph Farman , Brian Gardiner, and Jonathan Shanklin, discovered a recurring springtime Antarctic ozone hole .Their paper was published in Nature , May 1985, the study summarized data that had been collected by the British Antarctic Survey showing that ozone levels had dropped to 10% below normal January levels for Antarctica.
Dr Richard D. McPeters, Principal Investigator, Earth Probe TOMS at Goddard Space Flight Center explains "Our software had flags for ozone that was lower than 180 DU, a value lower than had ever been reliably reported prior to 1983. In 1984, before publication of the Farman paper, we noticed a sudden increase in low value from October of 1983. We had decided that the values were real and submitted a paper to the conference the following summer when Joe's paper came out, showing the same thing. As the first one in print, he gets full credit for discovery of the ozone hole. It makes a great story to talk about how NASA "missed" the ozone hole, but it isn't quite true."
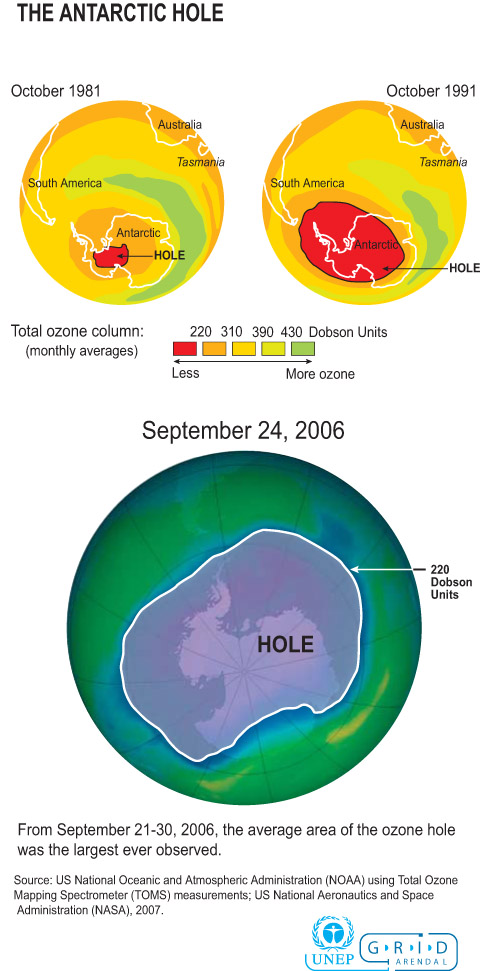
In the 1980's the first measurements of this loss were actually documented. In 1984, when the British first reported their findings, October ozone levels were about 35 percent lower than the average for the 1960s. When the first measurements were taken the drop in ozone levels in the stratosphere was so dramatic that at first the scientists thought their instruments were faulty.
NASA Nimbus 7
The U.S. satellite Nimbus-7 quickly confirmed the results, and the term Antarctic ozone hole entered popular language.
The ozone hole appeared first over the colder Antarctic because the ozone-destroying chemical process works best in cold conditions. The Antarctic continent has colder conditions than the Arctic, which has no land-mass. As the years have gone by the Ozone Hole has increased rapidly and is as large as the Antarctica continent. The hole lasts for only two months, but its timing could not be worse. Just as sunlight awakens activity in dormant plants and animals, it also delivers a dose of harmful ultraviolet radiation. After eight weeks, the hole leaves Antarctica, only to pass over more populated areas, including The Falkland Islands, South Georgia and the tip of South America. This biologically damaging, high-energy radiation can cause skin cancer, injure eyes, harm the immune system, and upset the fragile balance of an entire ecosystem. News about the ozone hole that forms over Antarctica each October has spread around the world. The ozone hole can be as big as 1.5 times larger than the United States.
Size Comparison Antarctica -United States
Below is a table of geographic areas to be used as references in conceptualizing just how large the ozone hole can get.
Source: NOAA Climate Prediction Center
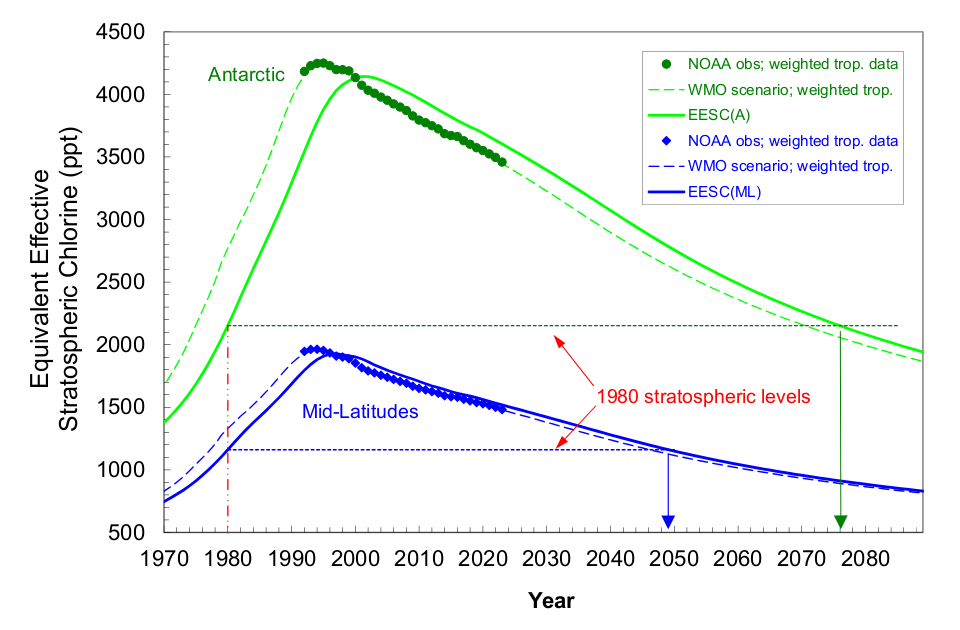
However, less-well-known is that ozone depletion has been measured everywhere outside the tropics, and that it is, in fact, getting worse. in the middle latitudes (most of the populated world), ozone levels have fallen about 10% during the winter and 5% in the summer. Since 1979, they have fallen about 5% per decade when averaged over the entire year. Depletion is generally worse at higher latitudes, i.e. further from the Equator. The severity of the ozone hole varies somewhat from year to year. Ozone Hole Maximum Area Over Time
http://ozonewatch.gsfc.nasa.gov
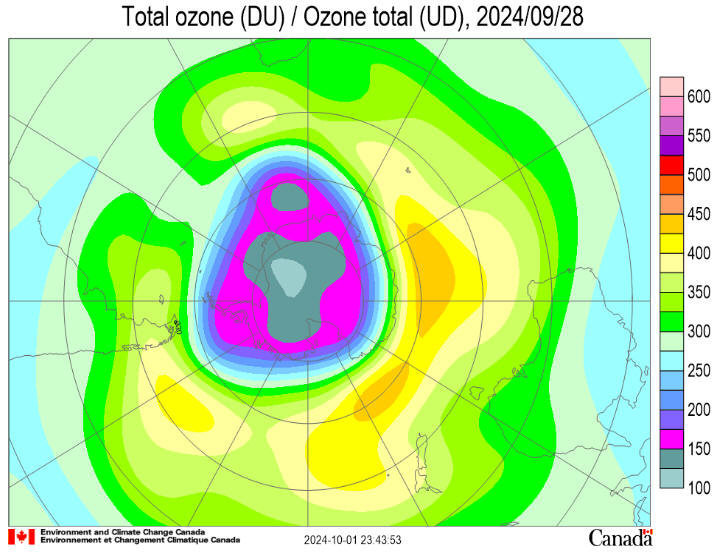
October 30, 2024 NASA, NOAA Rank 2024 Ozone Hole as 7th-Smallest Since Recovery Began Healing continues in the atmosphere over the Antarctic: a hole that opens annually in the ozone layer over Earth’s southern pole was relatively small in 2024 compared to other years. Scientists with NASA and the National Oceanic and Atmospheric Administration (NOAA) project the ozone layer could fully recover by 2066. During the peak of ozone depletion season from Sept. 7 through Oct. 13, the 2024 area of the ozone hole ranked the seventh smallest since recovery began in 1992, when the Montreal Protocol, a landmark international agreement to phase out ozone-depleting chemicals, began to take effect. At almost 8 million square miles (20 million square kilometers), the monthly average ozone-depleted region in the Antarctic this year was nearly three times the size of the contiguous U.S. The hole reached its greatest one-day extent for the year on Sept. 28 at 8.5 million square miles (22.4 million square kilometers). The improvement is due to a combination of continuing declines in harmful chlorofluorocarbon (CFC) chemicals, along with an unexpected infusion of ozone carried by air currents from north of the Antarctic, scientists said. In previous years, NASA and NOAA have reported the ozone hole ranking using a time frame dating back to 1979, when scientists began tracking Antarctic ozone levels with satellite data. Using that longer record, this year’s hole ranked 20th smallest in area across the 45 years of observations. “The 2024 Antarctic hole is smaller than ozone holes seen in the early 2000s,” said Paul Newman, leader of NASA’s ozone research team and chief scientist for Earth sciences at NASA’s Goddard Space Flight Center in Greenbelt, Maryland. “The gradual improvement we’ve seen in the past two decades shows that international efforts that curbed ozone-destroying chemicals are working.” The ozone-rich layer high in the atmosphere acts as a planetary sunscreen that helps shield us from harmful ultraviolet (UV) radiation from the Sun. Areas with depleted ozone allow more UV radiation, resulting in increased cases of skin cancer and cataracts. Excessive exposure to UV light can also reduce agricultural yields as well as damage aquatic plants and animals in vital ecosystems. Scientists were alarmed in the 1970s at the prospect that CFCs could eat away at atmospheric ozone. By the mid-1980s, the ozone layer had been depleted so much that a broad swath of the Antarctic stratosphere was essentially devoid of ozone by early October each year. Sources of damaging CFCs included coolants in refrigerators and air conditioners, as well as aerosols in hairspray, antiperspirant, and spray paint. Harmful chemicals were also released in the manufacture of insulating foams and as components of industrial fire suppression systems. The Montreal Protocol was signed in 1987 to phase out CFC-based products and processes. Countries worldwide agreed to replace the chemicals with more environmentally friendly alternatives by 2010. The release of CFC compounds has dramatically decreased following the Montreal Protocol. But CFCs already in the air will take many decades to break down. As existing CFC levels gradually decline, ozone in the upper atmosphere will rebound globally, and ozone holes will shrink. “For 2024, we can see that the ozone hole’s severity is below average compared to other years in the past three decades, but the ozone layer is still far from being fully healed,” said Stephen Montzka, senior scientist of the NOAA Global Monitoring Laboratory. Researchers rely on a combination of systems to monitor the ozone layer. They include instruments on NASA’s Aura satellite, the NOAA-20 and NOAA-21 satellites, and the Suomi National Polar-orbiting Partnership satellite, jointly operated by NASA and NOAA. NOAA scientists also release instrumented weather balloons from the South Pole Baseline Atmospheric Observatory to observe ozone concentrations directly overhead in a measurement called Dobson Units. The 2024 concentration reached its lowest value of 109 Dobson Units on October 5. The lowest value ever recorded over the South Pole was 92 Dobson Units in October 2006. NASA and NOAA satellite observations of ozone concentrations cover the entire ozone hole, which can produce a slightly smaller value for the lowest Dobson Unit measurement. “That is well below the 225 Dobson Units that was typical of the ozone cover above the Antarctic in 1979,” said NOAA research chemist Bryan Johnson. “So, there’s still a long way to go before atmospheric ozone is back to the levels before the advent of widespread CFC pollution.” View the latest status of the ozone layer over the Antarctic with NASA’s ozone watch.
By James
Riordon
Media Contact:
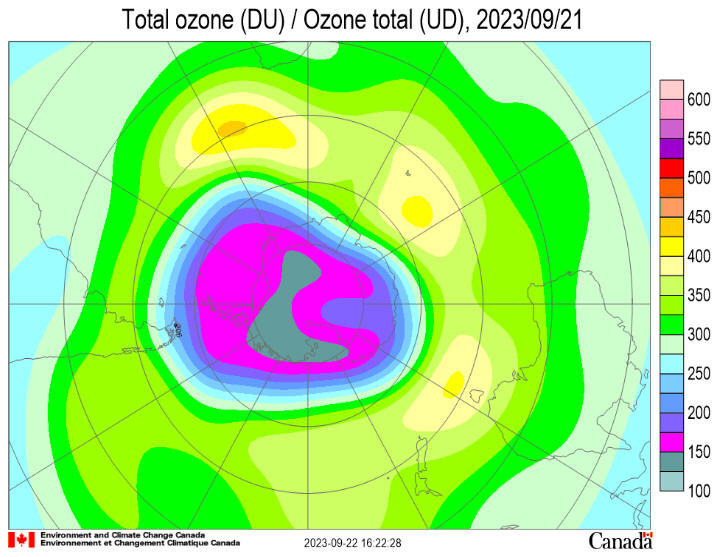
2023 Ozone Hole Ranks 16th Largest, NASA and NOAA Researchers FindNASA November 1 2023 -Kathryn Cawdrey
Editor’s note: This article has been updated to clarify the ranking of the 2023 ozone hole. It is the 12th largest single-day hole on record, and the 16th largest when averaged from Sept. 7 to Oct. 13. The 2023 Antarctic ozone hole reached its maximum size on Sept. 21, according to annual satellite and balloon-based measurements made by NASA and NOAA. At 10 million square miles, or 26 million square kilometers, the hole ranked as the 12th largest single-day ozone hole since 1979. During the peak of the ozone depletion season from Sept. 7 to Oct. 13, the hole this year averaged 8.9 million square miles (23.1 million square kilometers), approximately the size of North America, making it the 16th largest over this period. “It’s a very modest ozone hole,” said Paul Newman, leader of NASA’s ozone research team and chief scientist for Earth sciences at NASA’s Goddard Space Flight Center in Greenbelt, Maryland. “Declining levels of human-produced chlorine compounds, along with help from active Antarctic stratospheric weather slightly improved ozone levels this year.” The ozone layer acts like Earth’s natural sunscreen, as this portion of the stratosphere shields our planet from the Sun’s harmful ultraviolet radiation. A thinning ozone layer means less protection from UV rays, which can cause sunburns, cataracts, and skin cancer in humans. Every September, the ozone layer thins to form an “ozone hole” above the Antarctic continent. The hole isn’t a complete void of ozone; scientists use the term “ozone hole” as a metaphor for the area in which ozone concentrations above Antarctica drop well below the historical threshold of 220 Dobson Units. Scientists first reported evidence of ozone depletion in 1985 and have tracked Antarctic ozone levels every year since 1979. Antarctic ozone depletion occurs when human-made chemicals containing chlorine and bromine first rise into the stratosphere. These chemicals are broken down and release their chlorine and bromine to initiate chemical reactions that destroy ozone molecules. The ozone-depleting chemicals, including chlorofluorocarbons (CFCs), were once widely used in aerosol sprays, foams, air conditioners, fire suppressants, and refrigerators. CFCs, the main ozone-depleting gases, have atmospheric lifetimes of 50 to over 100 years. The 1987 Montreal Protocol and subsequent amendments banned the production of CFCs and other ozone-destroying chemicals worldwide by 2010. The resulting reduction of emissions has led to a decline in ozone-destroying chemicals in the atmosphere and signs of stratospheric ozone recovery. NASA and NOAA researchers monitor the ozone layer over the pole and globally using instruments aboard NASA’s Aura, NOAA-NASA Suomi NPP, and NOAA-20 satellites. Aura’s Microwave Limb Sounder also estimates levels of ozone-destroying chlorine. Scientists also track the average amount of depletion by measuring the concentration of ozone inside the hole. At NOAA’s South Pole Baseline Atmospheric Observatory, scientists measure the layer’s thickness by releasing weather balloons carrying ozonesondes and by making ground-based measurements with a Dobson spectrophotometer. NOAA’s measurements showed a low value of 111 Dobson units (DU) over the South Pole on Oct 3. NASA’s measurements, averaged over a wider area, recorded a low of 99 DUs on the same date. In 1979, the average concentration above Antarctica was 225 DU. “Although the total column ozone is never zero, in most years, we will typically see zero ozone at some altitudes within the stratosphere over the South Pole,” said NOAA research chemist Bryan Johnson, project leader for the Global Monitoring Laboratory’s ozonesonde group. “This year, we observed about 95% depletion where we often see near 100% loss of ozone within the stratosphere.” The Hunga Tonga-Hunga Ha’apai volcano — which violently erupted in January 2022 and blasted an enormous plume of water vapor into the stratosphere – likely contributed to this year’s ozone depletion. That water vapor likely enhanced ozone-depletion reactions over the Antarctic early in the season. “If Hunga Tonga hadn’t gone off, the ozone hole would likely be smaller this year,” Newman said. “We know the eruption got into the Antarctic stratosphere, but we cannot yet quantify its ozone hole impact.”
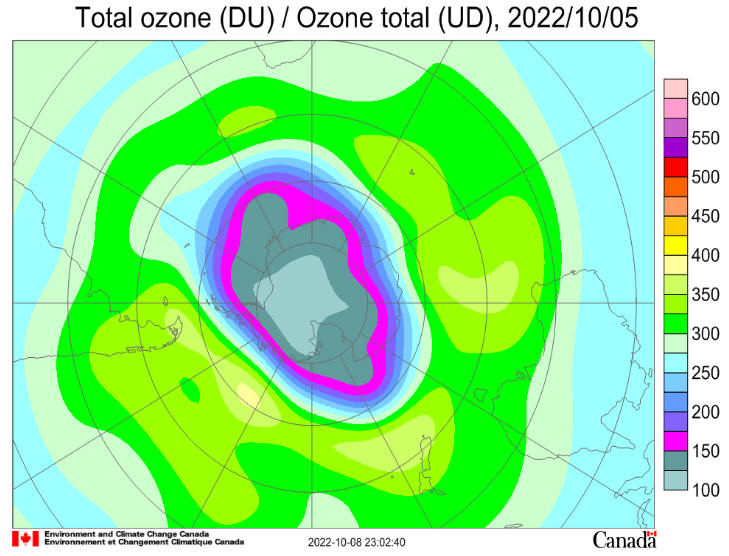
Media Contact: October 26, 2022 NASA The hole in the ozone layer — the portion of the stratosphere that protects our planet from the sun’s ultraviolet rays — is continuing to decrease. The hole over Antarctica had an average area of 8.91 million square miles (23.2 million square kilometers). That measurement is slightly smaller than the extent of 8.99 million square miles (23.3 million square kilometers) reached last year, and well below the average seen in 2006 when the hole size peaked.
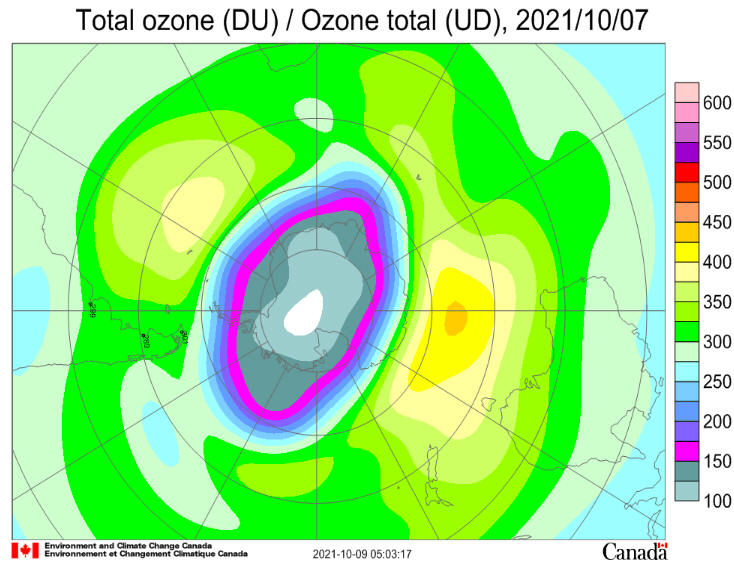
October 27, 2021 NASA The 2021
Antarctic ozone hole reached its maximum area on October 7 and ranks
as the 13th largest since 1979. Scientists from NASA and NOAA
reported that this year’s ozone hole developed similarly to last
year’s: A colder than usual Southern Hemisphere winter led to a deep
and larger-than-average ozone hole that will likely persist into
November or December.
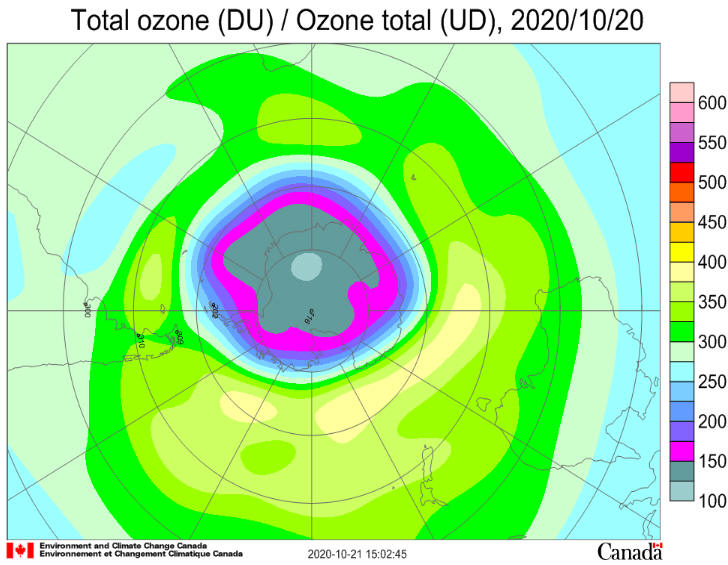
29 December 2020 WMOThe record-breaking 2020 Antarctic ozone hole finally closed at the end of December after an exceptional season due to naturally occurring meteorological conditions and the continued presence of ozone depleting substances in the atmosphereThe 2020 ozone hole grew rapidly from mid-August and peaked at around 24.8 million square kilometres on 20 September 2020, spreading over most of the Antarctic continent.
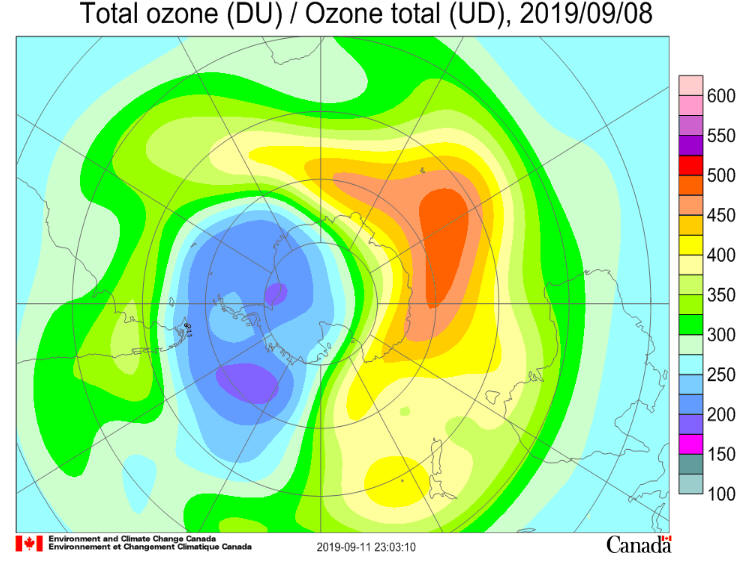
Oct. 21, 2019 NASA
Ozone Hole is the Smallest on Record
Since Its Discovery
The annual ozone hole reached its peak
extent of 6.3 million square miles (16.
4 million square kilometers) on Sept. 8,
and then shrank to less than 3.9 million
square miles (10 million square
kilometers) for the remainder of
September and October, according to NASA
and NOAA satellite measurements. During
years with normal weather conditions,
the ozone hole typically grows to a
maximum area of about 8 million square
miles in late September or early
October.
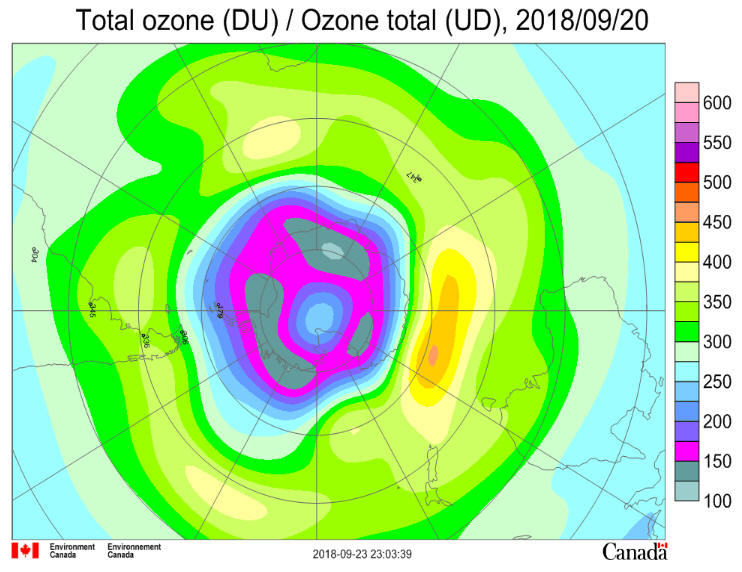
October 12, 2018-The ozone hole reached an average area of 22.9 million square kilometers (8.8 million square miles) in 2018, almost three times the size of the contiguous United States. It ranks 13th largest out of 40 years of NASA satellite observations.
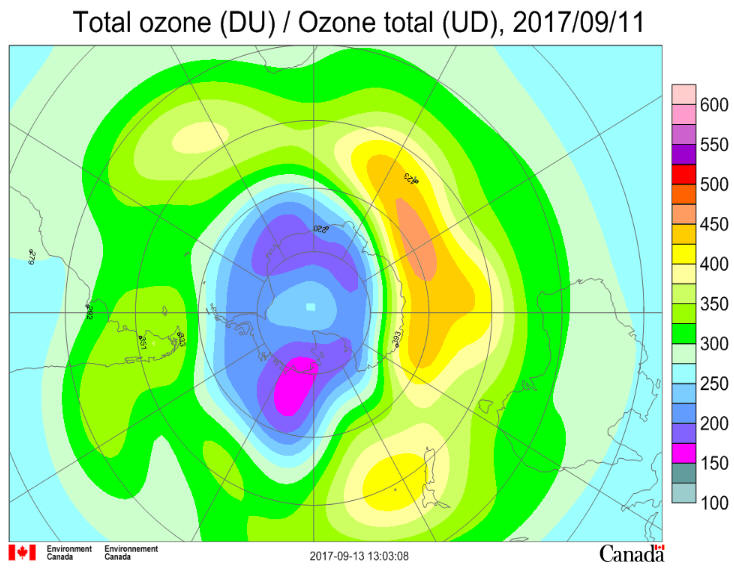
Warm Air Helped Make 2017 Ozone Hole Smallest Since 1988 Measurements from satellites this year showed the hole in Earth’s ozone layer that forms over Antarctica each September was the smallest observed since 1988, scientists from NASA and NOAA announced today. According to NASA, the ozone hole reached its peak extent on Sept. 11, covering an area about two and a half times the size of the United States – 7.6 million square miles in extent - and then declined through the remainder of September and into October. NOAA ground- and balloon-based measurements also showed the least amount of ozone depletion above the continent during the peak of the ozone depletion cycle since 1988. NOAA and NASA collaborate to monitor the growth and recovery of the ozone hole every year.
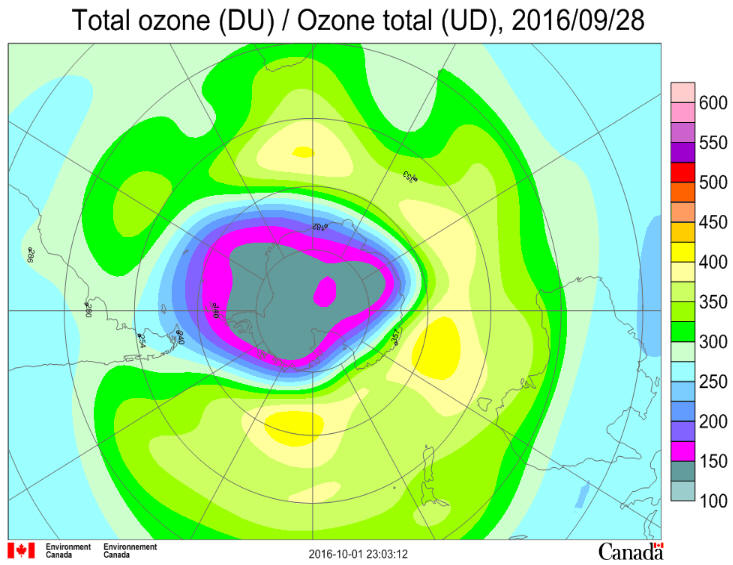
The hole in Earth’s ozone layer that forms over Antarctica each September grew to about 8.9 million square miles in 2016 before starting to recover, according to scientists from NASA and the National Oceanic and Atmospheric Administration (NOAA) who monitor the annual phenomenon. “This year we saw an ozone hole that was just below average size,” said Paul A. Newman, chief scientist for Earth Sciences at NASA's Goddard Space Flight Center in Greenbelt, Maryland. “What we’re seeing is consistent with our expectation and our understanding of ozone depletion chemistry and stratospheric weather.” At its peak on Sept. 28, 2016, the ozone hole extended across an area nearly three times the size of the continental United States. The average area of the hole observed since 1991 has been roughly 10 million square miles.
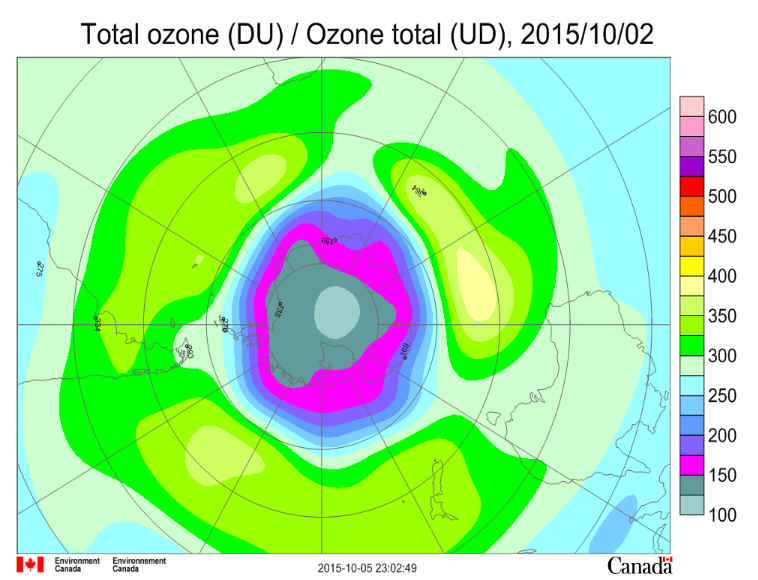
On October 2, 2015, OMI observed that the hole had reached its largest single-day area for the year. The image above, based on data acquired with OMI, shows the hole on that day. It spanned 28.2 million square kilometers (10.9 million square miles)—the fourth-largest area measured since the start of the satellite record in 1979. The largest single-day ozone hole recorded by satellite was 29.9 million square kilometers (11.5 million square miles) on September 9, 2000.
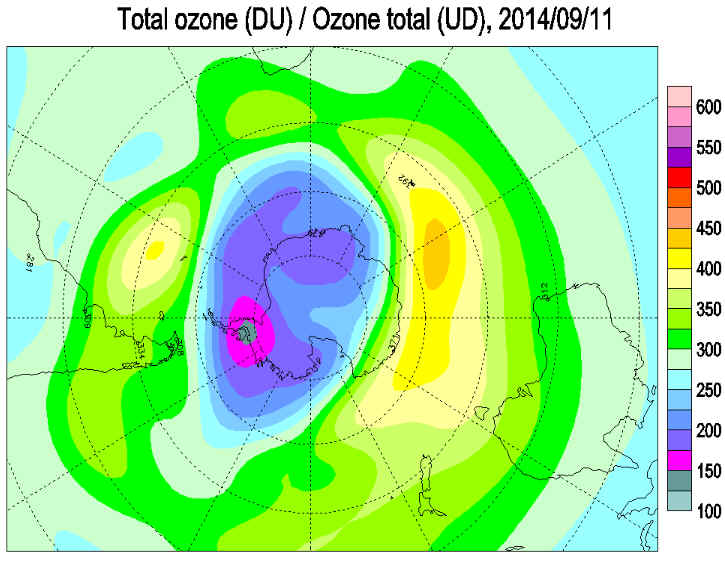
The Antarctic ozone hole reached its annual peak size on Sept. 11, 2014 according to scientists from NASA and the National Oceanic and Atmospheric Administration (NOAA). The size of this year’s hole was 24.1 million square kilometers (9.3 million square miles) — an area roughly the size of North America.
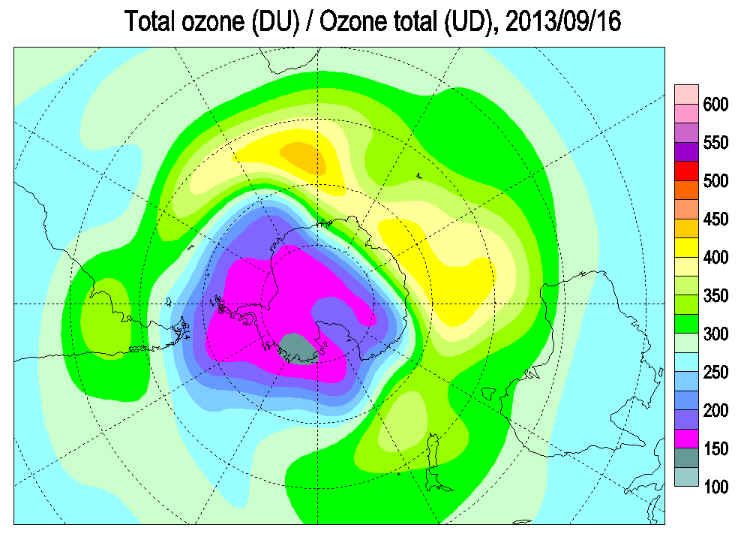
The ozone hole over Antarctica was slightly smaller in 2013 than the average for recent decades, according to data from the Ozone Monitoring Instrument (OMI) on NASA’s Aura satellite and the Ozone Monitoring and Profiler Suite (OMPS) on the NASA-NOAA Suomi NPP satellite. The average size of the hole in September–October 2013 was 21.0 million square kilometers (8.1 million square miles). The average size since the mid 1990s is 22.5 million square kilometers (8.7 million square miles). The single-day maximum area reached 24.0 million square kilometers (9.3 million square miles) on September 16—an area about the size of North America. credit NASA
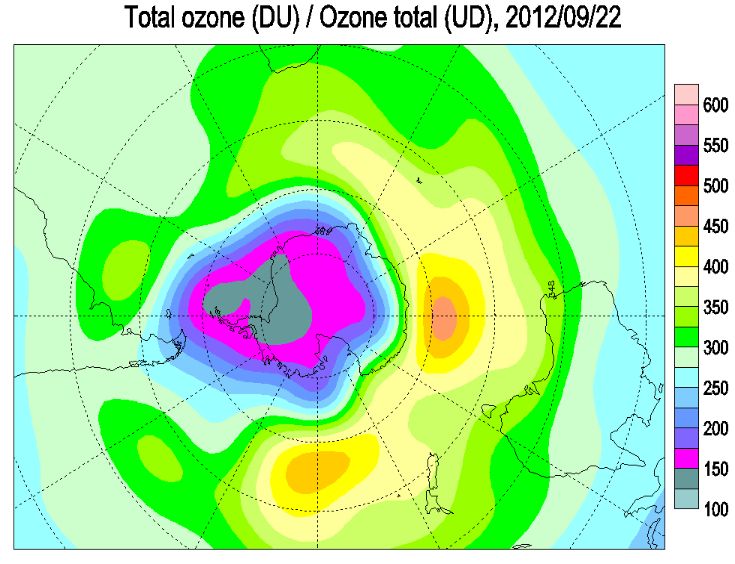
The ozone hole reached its maximum size Sept. 22, 2012 covering 8.2 million square miles (21.2 million square kilometers), or the area of the United States, Canada and Mexico combined. The average size of the 2012 ozone hole was 6.9 million square miles (17.9 million square kilometers).
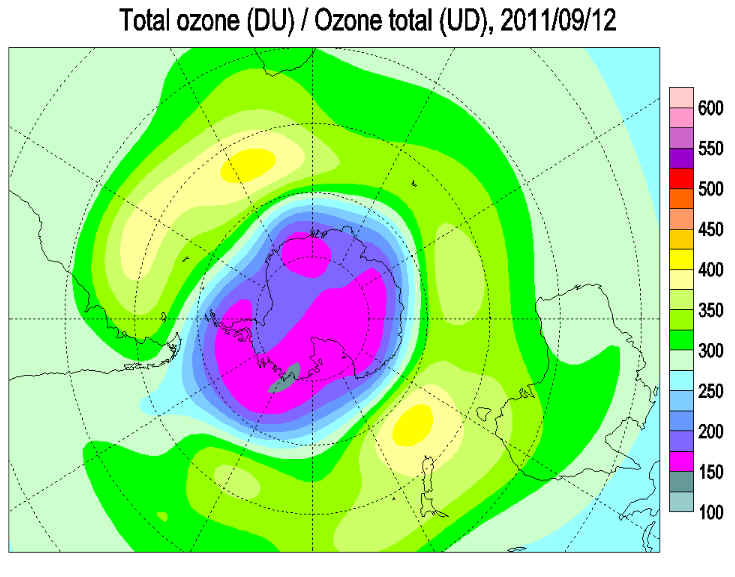
The 2011 Ozone Hole reached it's largest size of 26 million square kilometers on September 12,2011
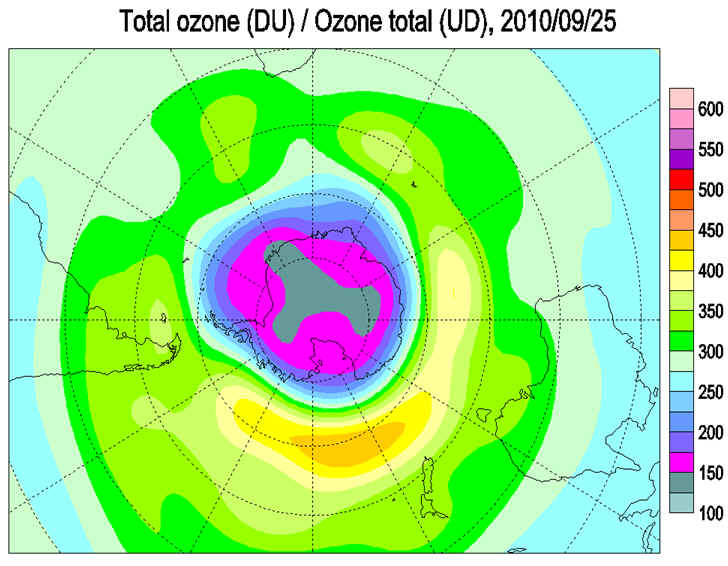
2010 ozone hole smaller than usual MACC - Monitoring Atmospheric Composition and Climate-The destruction of ozone in the ozone layer over Antarctica this year is about 40 to 60% less compared to the previous five years, according to MACC analyses based on observations from the SCIAMACHY instrument on board the European ENVISAT satellite. Less ozone destruction is consistent with the expectation that the ozone layer will recover during the coming decades due to reduction in the stratospheric amount of chlorine. However, such a large change cannot be attributed to the slow decrease of stratospheric chlorine of 0.5-1% per year. This year’s reduced ozone destruction turns out to be caused by unusual meteorological conditions. The Ozone Hole of 2010 was the second smallest in over a decade. It reached it's largest size of 22.6 million square kilometers on September 25,2010 which is below the decade average of 25.7 million square kilometers.
Sudden Stratospheric Warming Effect of nitrogen-oxides on
chlorine release Although the temperature in the
Antarctic stratosphere sinks below -78°C every July and August, it does not get
much colder. A small temperature rise of only a few degrees thus can result in
considerably more nitrogen-oxides remaining in the stratosphere, and thus less
effective ozone destruction. Recent measurements of the American MLS instrument
on the AURA satellite indeed show that there are still nitrogen-oxides present
in the stratosphere above Antarctica, unlike previous years. Late onset of ozone desctruction
in 2010
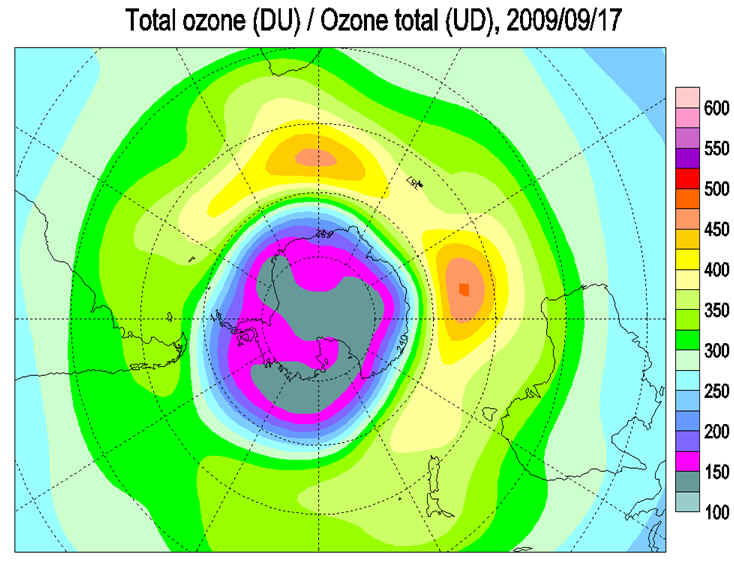
Situation at 2009 December 3British Antarctic Survey Ozone BulletinThe 2009 ozone hole is essentially over, with most of the continent experiencing a stratospheric spring warming. The residual vortex is over the Dronning Maud Land and here minimum ozone values are around 240 DU and ozone depletion exceeds 30%. Ozone values outside the polar vortex have dropped to near 400 DU, and inside the vortex ozone values are rapidly increasing as the atmosphere warms, though the summer circulation is not yet fully established. The temperature of the ozone layer over Antarctica is now too warm for polar stratospheric clouds (PSCs) to form. During the early winter, the polar vortex was often rather more elliptical than it was in 2008, and this lead to some early depletion in circumpolar regions as stratospheric clouds became exposed to sunlight. It reverted to a more circular circulation as winter progressed and this led to another relatively slow start to the growth of the ozone hole (as measured by NASA/SBUV2), with the "hole" not beginning until mid August. The vortex became more elliptical again in late August, with South Georgia being affected by the fringes of the ozone hole between September 2 and 6. The hole grew to reach an area of around 24 million square kilometres by mid September, and then lasted until the end of November. From mid August to mid November it remained around the average area seen over the past decade. The tip of South America and South Georgia were affected by the fringes of the ozone hole from September 24 to September 30, from October 3 to October 7 and from November 8 to 25. South Georgia was affected on November 6.
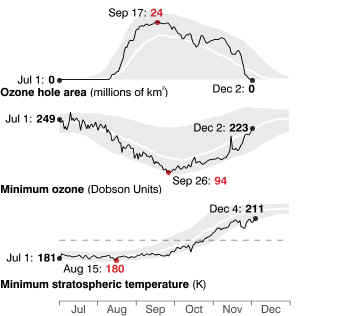
In 2009, the ozone hole reached its 10th largest measured size since careful measurements began in 1979.The daily maximum ozone hole area for 2009 was 24 million km2 on 17 September.
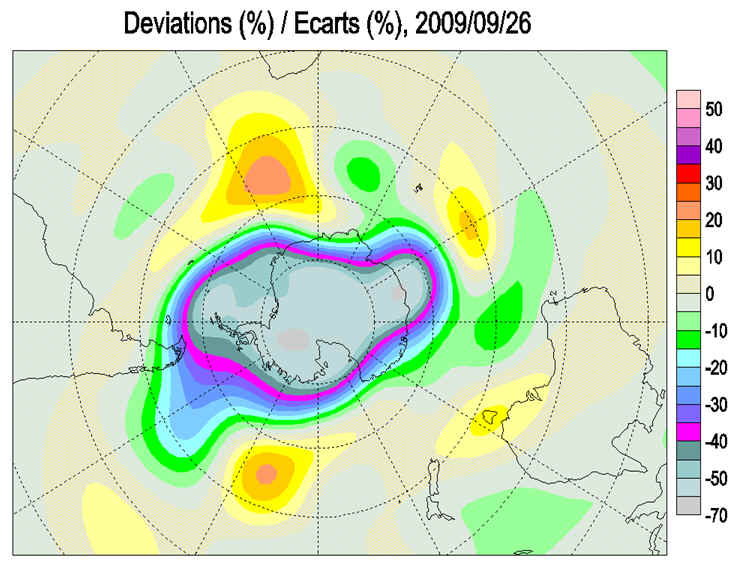
The daily minimum ozone value area for 2009 was 94 DU on 26 September.
Situation at 2008 November 21British Antarctic Survey Ozone BulletinThe 2008 ozone hole season is past its peak and ozone levels over Antarctica are slowly rising, with the ozone hole slowly shrinking. The polar vortex has been very stable throughout the season, however the final spring warming is expected towards the end of the month. During its initial stages, the ozone hole was much smaller than has been usual for August, but it grew rapidly as stratospheric clouds were exposed to sunlight. It covered over 25 million square kilometres in mid September, about the same as last year and remained at around 24 million square kilometres until early October. It is now around 14 million square kilometres, which is the largest on record for this time of year. The temperature of the ozone layer over Antarctica is rising as the spring warming takes hold, and is now generally too warm for polar stratospheric clouds (PSCs) to continue to exist. The temperature within the polar vortex is generally a little below the normal. Ozone values are above 350 DU in parts of the circum-polar regions, which is a bit lower than at this time last year. Lowest values, near 160 DU, are offset slightly from the pole towards the Weddell Sea. The vortex briefly showed a more elliptical circulation pattern, and the ozone hole extended over the tip of South America, the Falkland Islands and South Georgia between October 28th and 30th. PSCs were seen from Rothera on several occasions and also at Halley.
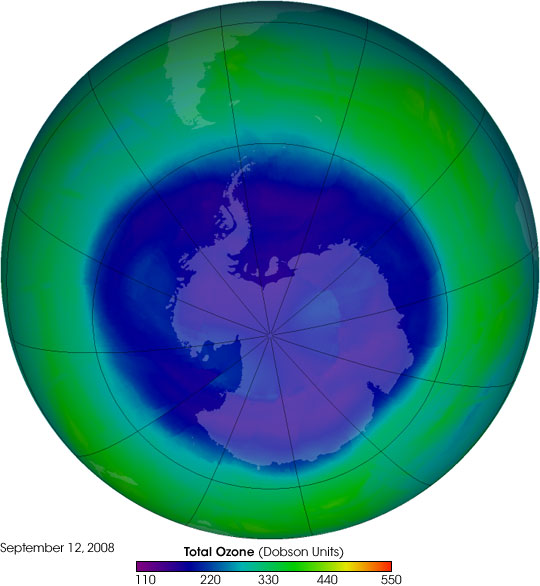
On September 12, 2008, the Antarctic ozone hole reached its maximum size for the year. Represented by blues and purples in this image from the Ozone Monitoring Instrument (OMI) on NASA Aura satellite, the ozone hole covered about 27 million square kilometers, making it larger than North America, which is about 25 million square kilometers. Though larger than it was in 2007, the 2008 ozone hole was still smaller than the record set in 2006.
Situation at 2007 December 28 British Antarctic Survey Ozone Bulletin The ozone hole of 2007 is over. The temperature of the ozone layer is now highest over Antarctica and cools northwards. It is too warm for polar stratospheric clouds (PSCs) to exist. Generally across Antarctica, ozone values are around 300 DU. Values are now slowly dropping towards the normal autumn normal minimum. In general the circum-polar stratospheric vortex was more disturbed this year than it was last year, however there were also periods of stability. Some areas of Antarctica saw ozone values down to ozone hole levels (less than 220 DU) in mid June, suggesting the possibility of early chemical depletion, combined with some dynamic processes. In mid July the minimum temperature of the Antarctic stratosphere at 70 & 50 hPa was close to the normal, although that at 30 hPa was below the normal, and I suggested the likelihood of another strong ozone hole year. Early August saw the largest ozone hole recorded for this time of year, although at the same time very high ozone levels existed over the northern Antarctic Peninsula. The vortex was more circular in mid September but returned to an elliptical shape and initially warmed slowly. In mid September the ozone hole area reached a maximum of just over 24 million square kilometres, but it then slowly shrank as the vortex warmed further. A spring warming took place over the Pacific coast of Antarctica and the Antarctic Peninsula in late October, however this subsided as the ozone hole became more symmetric again. A second major warming took place towards the end of November, but subsided in early December. Around December 8 the ozone hole was briefly the largest on record for the date. The tip of South America and the Falkland Islands saw ozone levels below 250 DU on August 24, with South Georgia experiencing similar levels on September 4. The fringes of the ozone hole were over South Georgia on September 11. The area was intermittently affected from September 22 to October 22, with South Georgia particularly affected on September 25, when values dropped below 175 DU. The Falklands and South Georgia were affected for a final time between November 23 and 25.
Data from NASA's Earth-observing Aura satellite show that the ozone hole peaked in size on Sept. 13,2007 reaching a maximum area extent of 9.7 million square miles(24.7Area (million sq. km)) just larger than the size of North America. That's "pretty average," says Paul Newman, an atmospheric scientist at NASA Goddard Space Fight Center, when compared to the area of ozone holes measured over the last 15 years. Still, the extent this year was "very big," he says, compared to 1970s when the hole did not yet exist. 2007 Climate Prediction Center summary-Extensive ozone depletion was again observed over Antarctica during the Southern Hemisphere winter of 2007, with widespread total ozone anomalies of 45 percent or more below the 1979 to 1986 base period. The area covered by extremely low total ozone values of less than 220 Dobson Units, defined as the Antarctic “Ozone Hole” area, in September reached maximum size of greater than 24 million square kilometers, the 7th largest over all 29 years of continuous satellite monitoring of Antarctic ozone. However, after reaching its maximum size, the Ozone Hole diminished in size such that it was just the 17th largest for the month of October. Vertical profiles of ozone amounts, measured by balloon-sondes over the South Pole, showed near-complete destruction of ozone in the 13 to 21 km region for a relatively short period of time due to the Ozone Hole’s displacement off of the pole towards the Atlantic quadrant. Minimum total ozone values observed at the South Pole were higher than those seen during recent years. Lower stratospheric temperatures over the Antarctic region in the winter of 2007 were again well below -78ºC, and were sufficiently low for polar stratospheric cloud formation, promoting chemical ozone loss. The size of the area of very low temperatures in 2007 was, however, average or below average for the past ten years. The polar vortex persisted until mid-December when it and the remains of the Ozone Hole slowly diminished as the polar circulation changed over into its summer pattern. 3 October2006 World Meteorological Organization This year’s hole in the Antarctic ozone layer was the most serious on record exceeding that of 2000. Not only was it the largest in surface area (matching 2000) but also suffered the most mass deficit, meaning that there was less ozone over the Antarctic than ever previously measured.
European Space Agency
Measurements were taken from instruments on both NASA and European Space Agency (ESA) satellites. These are validated by surface based observations of the WMO Global Atmosphere Watch (GAW) ozone network. Each agency uses different instruments hence the slightly different values. NASA instruments showed that, on 25 September 2006, the area of the hole reached 29.5 million km2, compared to 29.4 million km2 reached in September 2000.
2006 Climate Prediction Center summary-Very low ozone values were again observed over Antarctica in the winter of 2006. Ozone depletion of more than 45 percent was observed over Antarctica, compared to total ozone amounts observed in the early 1980's. Vertical soundings over the South Pole during August, September and October 2006 again showed strongest destruction of ozone at altitudes between 13 and 21 km. Lower stratosphere temperatures in the winter of 2006 over the Antarctic region were lower than in 2005 and near record levels. Associated with this, the ozone hole was larger than in other years. The ozone hole in 2006 diminished in size and depth along with warming stratospheric conditions in October, and by early December, total ozone over Antarctica had increased to levels above ozone hole values. The stability of the stratospheric polar vortex structure, which kept it generally centered over the South Pole, and the very persistent, anomalously cold temperatures in the presence of halogen levels that remain at high levels (though no longer at their highest levels) were the prime contributors to the record setting depletion. 2005 Climate Prediction Center summary-In the winter of 2005-2006, positive anomalies of total ozone were prevalent in the high latitudes of the Northern Hemisphere. The positive anomalies in total ozone were associated with the meteorological conditions of positive anomalies of lower stratosphere temperature. Arctic temperatures were not sufficiently low for the formation of polar stratospheric clouds and consequent chemical ozone depletion within the polar vortex. Chlorine and other ozone destroying chemicals in the lower stratosphere reached peak values around 1997-98, and have remained at high levels. Lower stratosphere ozone destruction is strong when meteorological conditions of a strong polar vortex and cold polar temperatures prevail. Those cold conditions were not present in the lower stratosphere in the winter of 2005-2006. Total ozone declined over mid-latitudes of the Northern Hemisphere at the rate of about 2 to 4 percent per decade from 1979 to 1993. In recent years the strong rate of decline of Northern Hemisphere total ozone has not continued, but current stratospheric ozone amounts continue to be below the amounts measured before the early 1980s. A full explanation of ozone and temperature anomalies must include all aspects of ozone photochemistry and meteorological dynamics. Continued monitoring and measurements are essential toward this end. 2004 Climate Prediction Center summary-Very low ozone values were again observed over Antarctica in the winter/spring of 2004. Ozone depletion of more than 45 percent was observed over Antarctica, compared to total ozone amounts observed in the early 1980's. Vertical soundings over the South Pole during August, September and October 2004 again showed strongest destruction of ozone at altitudes between 15 and 20 km. Lower stratosphere temperatures in the winter of 2004 over the Antarctic region were higher than in 2003. Associated with this, the ozone hole area was smaller than in 2003. The ozone hole in 2004 diminished in size and depth along with warming stratospheric conditions in September and October, and, by mid-November, total ozone over Antarctica had increased to levels above ozone hole values. Observations of chloroflourocarbons and of stratospheric hydrogen chloride support the view that international actions are reducing the use and release of ozone depleting substances (WMO, 1999; Anderson et al., 2000). However, chemicals already in the atmosphere are expected to continue to impact the ozone amount for many decades to come. Further, changing atmospheric conditions that modulate ozone can complicate the task of detecting the start of ozone layer recovery. The eruption of the Pinatubo volcano provided an example of such a complication in the 1990s. Based on an analysis of 10 years of South Pole ozone vertical profile measurements, Hofmann et al., (1997) estimated that recovery in the Antarctic ozone hole may be detected as early as the coming decade. Indicators include: 1) an end to springtime ozone depletion at 22-24 km, 2) 12-20 km mid-September column ozone loss rate of less than 3 DU per day, and 3) a 12-20 km ozone column of more than 70 DU on September 15. An intriguing aspect of recent observations of the Antarctic stratosphere had been the apparent trend towards a later breakup of the vortex in years since 1990, relative to the 1980s. The limited duration and size of the 2004 ozone hole is attributed in part to meteorological conditions. A full explanation of such meteorological anomalies is not yet available. Continued monitoring and measurements, including total ozone and its vertical profile, are essential to achieving the understanding needed to identify ozone recovery. 2003 Climate Prediction Center summary-Very low ozone values were again observed over Antarctica in the winter/spring of 2003. Ozone depletion of more than 40 percent was observed over Antarctica, compared to total ozone amounts observed in the early 1980's. Vertical soundings over the South Pole during August, September and October 2003 again showed strongest destruction of ozone at altitudes between 15 and 21 km. Lower stratosphere temperatures in the winter of 2003 over the Antarctic region were also much lower than average values. Associated with this, the ozone hole area in August and September was among the largest of any previous year. The ozone hole diminished in October and November along with warming stratospheric conditions. So although the Antarctic ozone hole in 2003 reached unprecedented size, the duration of the extremely low ozone conditions was limited by warmer meteorological conditions which developed in October and November. Observations of chloroflourocarbons and of stratospheric hydrogen chloride support the view that international actions are reducing the use and release of ozone depleting substances (WMO, 1999; Anderson et al., 2000). However, chemicals already in the atmosphere are expected to continue to deplete ozone for many decades to come. Further, changing atmospheric conditions that modulate ozone can complicate the task of detecting the start of ozone layer recovery. The eruption of the Pinatubo volcano provided an example of such a complication in the 1990s. Based on an analysis of 10 years of South Pole ozone vertical profile measurements, Hofmann et al., (1997) estimated that recovery in the Antarctic ozone hole may be detected as early as the coming decade. Indicators include: 1) an end to springtime ozone depletion at 22-24 km, 2) 12-20 km mid-September column ozone loss rate of less than 3 DU per day, and 3) a 12-20 km ozone column of more than 70 DU on September 15. An intriguing aspect of recent observations of the Antarctic stratosphere had been the apparent trend towards a later breakup of the vortex in most recent years. The large size of the August-September 2003 ozone hole but its limited duration in October-November is attributed in part to meteorological conditions. A full explanation of such meteorological anomalies is not yet available. Continued monitoring and measurements, including total ozone and its vertical profile, are essential to achieving the understanding needed to identify ozone recovery. 2002 Climate Prediction Center summary-Very low ozone values were observed over Antarctica again in the Southern Hemisphere winter of 2002. Ozone depletion of more than 40 percent was observed over Antarctica compared to total ozone amounts observed in the early 1980's. Vertical soundings over the South Pole during September and October 2002 again showed strong destruction of ozone at altitudes between 15 and 20 km. However, for the year 2002, the ozone hole declined rapidly in late September, and had the shortest duration of any year since 1988. Lower stratosphere temperatures in the winter and spring of 2002 over the Antarctic region were much higher than average values. Associated with this, the ozone hole area was among the smallest of recent years. Observations of chloroflourocarbons and of stratospheric hydrogen chloride support the view that international actions are reducing the use and release of ozone depleting substances ; Anderson et al., 2000). However, chemicals already in the atmosphere are expected to continue to deplete ozone for many decades to come. Further, changing atmospheric conditions that modulate ozone can complicate the task of detecting the start of ozone layer recovery. The eruption of the Pinatubo volcano provided an example of such a complication in the 1990s. Based on an analysis of 10 years of South Pole ozone vertical profile measurements, estimated that recovery in the Antarctic ozone hole may be detected as early as the coming decade. Indicators include: 1) an end to springtime ozone depletion at 22-24 km, 2) 12-20 km mid-September column ozone loss rate of less than 3 DU per day, and 3) a 12-20 km ozone column of more than 70 DU on September 15. An intriguing aspect of recent observations of the Antarctic stratosphere had been the apparent trend towards a later breakup of the vortex in most recent years. However, the limited size and duration of the 2002 ozone hole is attributed to highly unusual meteorological conditions this year. A full explanation of such meteorological anomalies is not yet available. Continued monitoring and measurements, including total ozone and its vertical profile, are essential to achieving the understanding needed to identify ozone recovery. http://www.cpc.ncep.noaa.gov/products/stratosphere/winter_bulletins/sh_02/index.html 2001 Climate Prediction Center summary-Very low ozone values were observed over Antarctica again in 2001. Ozone depletion of 10 percent to more than 40 percent was observed over Antarctica compared to total ozone amounts observed in the early 1980's. Vertical soundings over the South Pole during late September and early October 2001 again showed complete destruction of ozone at altitudes between 15 and 20 km. Lower stratosphere temperatures in the winter and spring of 2001 over the Antarctic region were below average values, and were sufficiently low for ozone production of polar stratospheric clouds within the polar vortex. The ozone hole area and the PSC area were again among the largest of all previous years. For the year 2001, the ozone hole and Southern Hemisphere polar vortex persisted into December, again among the longest duration of years since 1982. Observations of chloroflourocarbons and of stratospheric hydrogen chloride support the view that international actions are reducing the use and release of ozone depleting substances . However, chemicals already in the atmosphere are expected to continue to deplete ozone for many decades to come. Further, changing atmospheric conditions that modulate ozone can complicate the task of detecting the start of ozone layer recovery. The eruption of the Pinatubo volcano provided an example of such a complication in the 1990s. Based on an analysis of 10 years of South Pole ozone vertical profile measurements, estimated that recovery in the Antarctic ozone hole may be detected as early as the coming decade. Indicators include: 1) an end to springtime ozone depletion at 22-24 km, 2) 12-20 km mid-September column ozone loss rate of less than 3 DU per day, and 3) a 12-20 km ozone column of more than 70 DU on September 15. However, an intriguing aspect of recent observations of the Antarctic stratosphere is the apparent trend towards a later breakup of the vortex. A full explanation of such meteorological anomalies is not yet available. Continued monitoring and measurements, including total ozone and its vertical profile, are essential to achieving the understanding needed to identify ozone recovery. http://www.cpc.ncep.noaa.gov/products/stratosphere/winter_bulletins/sh_01/index.html British Antarctic Survey summary 2000-The 2000 ozone hole reached its greatest extent in early September at 28.4 million square kilometres and was the largest ever-recorded ozone hole. It reached this maximum extent unusually early, as the hole is normally largest in late September. Minimum ozone values were measured in early October and were amongst the lowest on record. The edge of the ozone hole passed over the tip of South America and the Falkland Islands for significant periods between October 6 and 24. The hole also closed in unusually early and the event was essentially over by early December. This early closure of the hole is probably linked with the QBO/ENSO and in retrospect was to be expected. British Antarctic Survey summary 1999- The ozone layer over Antarctica evolved in a broadly similar way in 1999/2000 to each of the past few years. Significant ozone depletion over Halley had already occurred by late August and maximum depletion, of 60%, occurred in early October. The ozone hole filled rapidly in early December, however a remnant area over central Antarctica, with ozone values below 240 DU, persisted until early February. Ozone values remained at around 255 DU at Halley for the rest of the season (15% below the normal). At Vernadsky ozone values slowly fell from a peak in mid December until the end of March but rose by 30 DU in April. Stratospheric temperatures at Halley remained below the normal from late September until early April. British Antarctic Survey summary 1998-The 1998 Antarctic ozone hole was broadly similar to those seen in recent years, although a little larger and a little longer lasting. At Halley the final spring warming did not take place until late December and a remnant of the ozone hole passed over the station in late January. Mean total ozone values declined from around 260 DU in early August to a minimum of 120 DU in early October at a rate of around 3 DU per day. They rose a little, but oscillated around 180 DU from late October until the final warming began in early December. Peak ozone values of around 290 DU occurred in late December, but this was nearly a month later and 25% lower than the historical maximum. Values slowly declined from this peak through the rest of the summer. Unusually low ozone values and 100 hPa temperatures were recorded around January 21 when a remnant of the ozone hole passed over the station. Autumn values were around 260 DU, some 15% below normal. British Antarctic Survey summary 1997-Overall the 1997/98 ozone season was comparable to those of recent years, with minimum ozone values of around 110 DU at Halley. The spring warming took place slightly earlier than in the past two years, leading to a higher annual mean. The January and February means for Vernadsky were the lowest on record. The 100 hPa temperature over Halley and Vernadsky was below the long term mean for most of the season.Total ozone values fell from an estimated 300 DU in early July to around 200 DU in mid August. Values rose to around 240 DU towards the end of August but then steadily fell to reach 115 DU in early October. Ozone values rose to around 160 DU late in October and remained near this value until mid November when the spring warming started. Values peaked at just under 300 DU in early December, compared to the long term mean peak of 380 DU. Summer values declined to a plateau in early January at around 260 DU. Daily variation began to increase at the beginning of March, although mean values have changed little. Ozone values remained significantly below the long term mean throughout the year. British Antarctic Survey summary 1996-Routine ozone measurements from Halley station do not start until towards the end of August because the sun is not high enough to permit measurements. Mean total ozone values fell from an estimated 260 DU in early July to around 140 DU in mid September and then declined more slowly to reach 125 DU in early October. They climbed to around 180 DU by late October, but remained at that level throughout November. In early December, ozone levels began to rise and reached a peak of around 300 DU late in the month. This is some 80 DU lower than the pre-ozone hole average peak value. After that, values slowly declined and had reached around 230 DU by the end of the season. Values only briefly exceeded the lower bound of the variation from the long-term mean late in the season. The lowest mean daily value seen (114 DU on October 8) is comparable to that of the previous few years. British Antarctic Survey summary 1995-Preliminary mean daily ozone values dropped from values of around 280 Dobson Units (DU) at the beginning of August to around 175 DU at the end of September (50% depletion). Individual daily values dropped as low as 132 DU. The first week of October saw a major spring warming event, with a rise in mean total ozone to over 300 DU as the circumpolar high ozone belt moved across the station. Mean values then fell back to around 190 DU in mid October before rising again to over 300 DU in a second warming event at the end of October. Mean values dropped back again to 200 DU in early November before slowly rising to around 315 DU in the final warming event of the year in mid December. Values slowly declined from the December peak to around 260 DU at the end of April. Generally values in the 95/96 season were a little above those reached in 1993 and 1994 during the first half of the season and below during the second half. The final spring warming was much later than in either year. Values were significantly below those of the long term mean throughout the season. British Antarctic Survey summary 1994-Preliminary mean ozone values from Faraday show that mean ozone values at the end of the winter were around 290 DU dropping to a minimum of around 160 DU by mid October (55% depletion). This is the steepest decline recorded at this station, and the minimum mean values were about 40 DU below those at the same time last year. The mean for September is the lowest September mean recorded at the station; 133 DU recorded at the end of the month is the lowest ever September mean daily value. Individual values of 130 DU in early October represent nearly 65% depletion and are the second lowest on record for the station. A strong spring warming episode occurred between October 20th and 28th, with a very rapid rise to 400 DU on October 22nd; this is the earliest the warming has occurred for several years and is also the steepest rise (some 250 DU in three days). Following the event mean values dropped to 180 DU (50% depletion), and then slowly rose again, reaching 230 DU by November 23rd. The final spring warming occurred between November 21st and 23rd with mean ozone values rising rapidly to around 340 DU by the end of November. The November monthly mean is the second lowest on record. Values in early December were near normal at around 360 DU, but were generally below normal throughout the late summer and autumn. Preliminary ozone measurements from Halley show that mean ozone values dropped from around 180 DU at the end of August to 105 DU in early October (65% depletion), then slowly rose to reach 160 DU by November 7th. A minor peak occurred between November 7th and 17th, with a maximum of 230 DU on the 11th, followed by a decline to 185 DU. The spring warming commenced on November 24th with ozone levels peaking at around 350 DU in late November and then slowly declining. The monthly means for September and October are between those of 1992 and 1993. Mean values throughout the summer and autumn were significantly below those of the long term mean and throughout the season no daily values exceeded those of the long term mean. The data from 1956 - 1994 suggest that the mean for October 1995 will be around 120 DU, with minimum values below 100 DU. The temperature at 100 hPa rose slowly from the winter value of around -82 deg C in early October to reach -67 deg C by November 22nd (some 15 degrees below normal). The final warming then took place with the temperature reaching near normal values of around -40 deg C by the end of the month. The temperature then slowly declined, reaching -60 deg C by the end of April. The ozone values from Halley and Faraday are consistent with a hole of greater maximum extent than in 1993, but slightly shallower. NASA GSFC images from Meteor-3/TOMS and radiosonde data suggest that the edge of the hole was over the tip of South America and the Falkland Islands between October 11th and 21st, and was close to the region between October 29th and November 13th. The Falkland Islands now consider the ozone hole a major threat to health following cases of severe sunburn during this event. British Antarctic Survey summary 1993-Preliminary ozone values from the British Antarctic Survey Faraday station (65 south, 64 west on the coast of the Antarctic Peninsula) show running average ozone values dropping from around 280 DU at the begining of September to around 200 DU at the month's end. There is considerable day to day variation. Data from our long term record for the station indicate normal values of around 330 DU for this period (with a range of 280 DU to 380 DU). This year's mean September ozone value is 245 DU, giving a reduction of about 25%. The minimum September daily mean value of 142 DU on September 28th is the lowest ever recorded at Faraday (next lowest 145 DU in 1992). Preliminary ozone values from the British Antarctic Survey Halley station (76 south, 26 west on the Brunt ice shelf) show mean ozone values dropping from around 210 DU in early September to around 110 DU in early October. Data from our long term record for the station indicate normal values of around 300 DU for this period (with a range of 260 DU to 340 DU). This year's mean September ozone value of 159 DU is the second lowest recorded at Halley (lowest 146 DU in 1992), giving a reduction of around 35%. The minimum September daily mean value of 108 DU on September 30 is the lowest recorded at Halley (next lowest 111 DU in 1992). Ozone levels in early October are the lowest ever recorded with depletion exceeding two thirds. This year's Antarctic ozone hole (1993) is the deepest ever. Scientists of the British Antarctic Survey (BAS) at Halley Research Station in Antarctica have recorded their lowest ever value of ozone, showing that over two-thirds of the protective ozone shield has been destroyed. Less than one- third remains intact, and the depletion phase may not be over for some days yet. BAS scientists at Faraday Research Station, normally near the edge of the ozone hole, have also measured record low values of ozone for their station. The Antarctic ozone hole is an annual phenomenon which has occurred in every (southern hemisphere) spring since the late 1970s. It is caused by the chemical action of chlorine and bromine released from man-made chlorofluorocarbons (CFCs) and halons. Thanks to the international Montreal Protocol, the annual production of these substances is now less than before, but the total amount in the atmosphere continues to rise, dashing hopes of an early recovery for the ozone layer. The CFCs are not expected to reach their maximum concentration in the atmosphere until around the turn of the century, so the Antarctic ozone hole may continue to worsen until then. BAS scientists have been measuring ozone in Antarctica on a daily basis since 1957. There was no ozone hole at all until the late 1970s. The Antarctic ozone layer is not expected to return to normal until the 2070s.
Credit: NASA, ESA, WMO, BAS , Environment Canada |
||||||||||||||||||


