Unusual Weather Leads to Ozone Low Over the Arctic
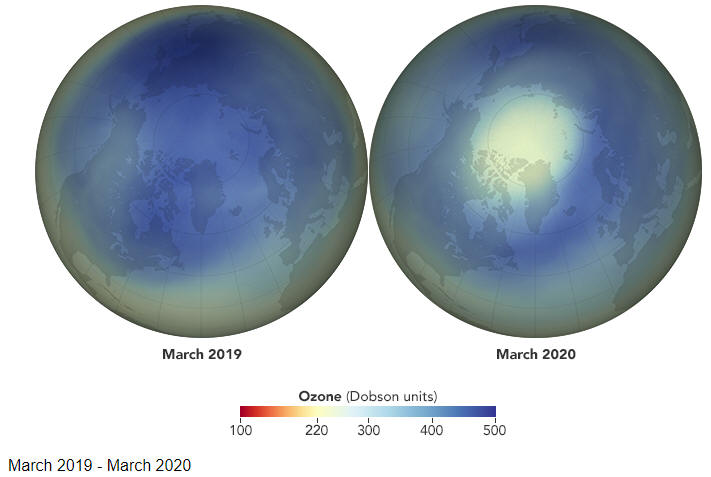
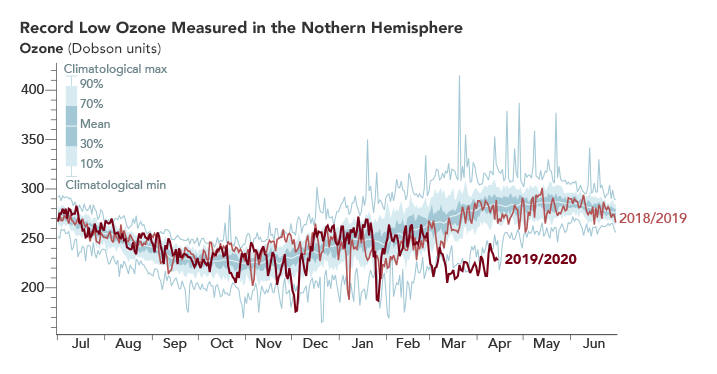
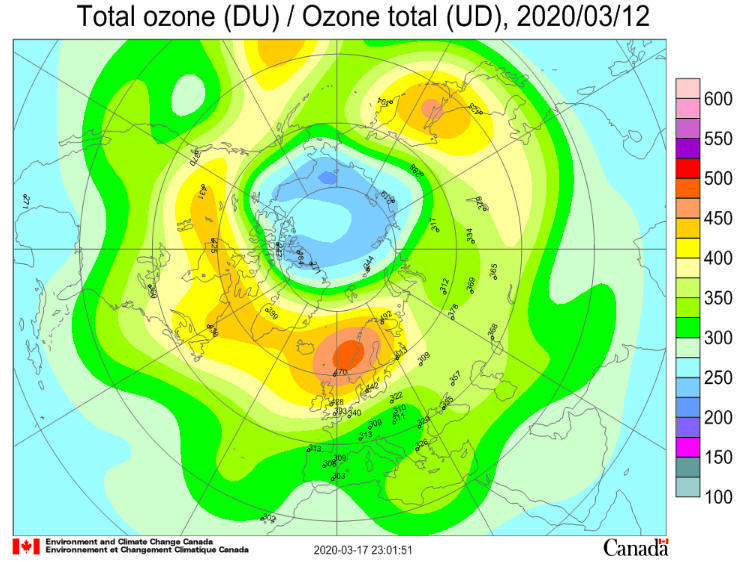
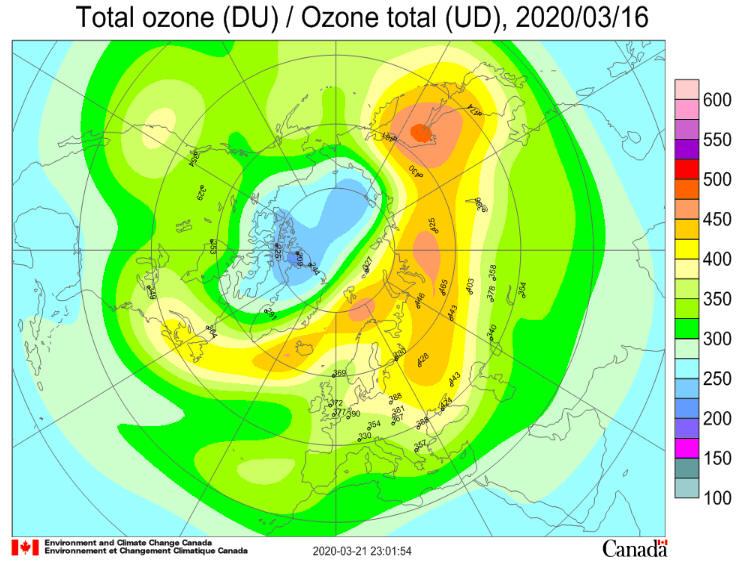
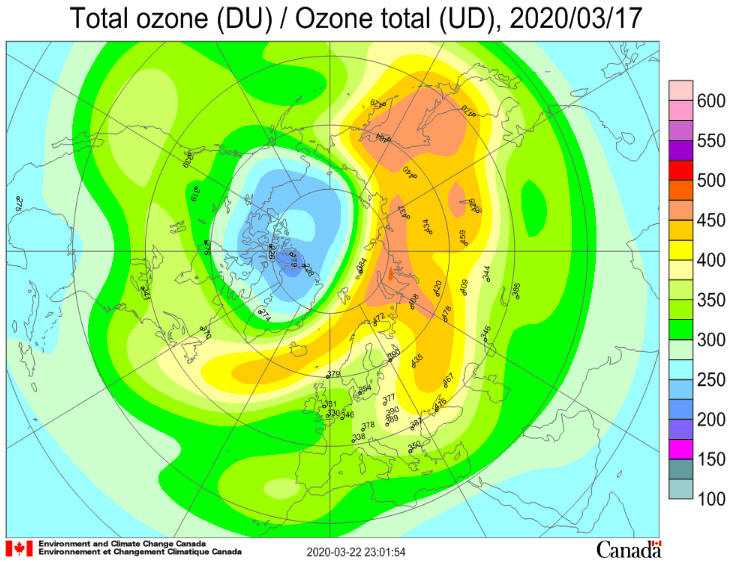
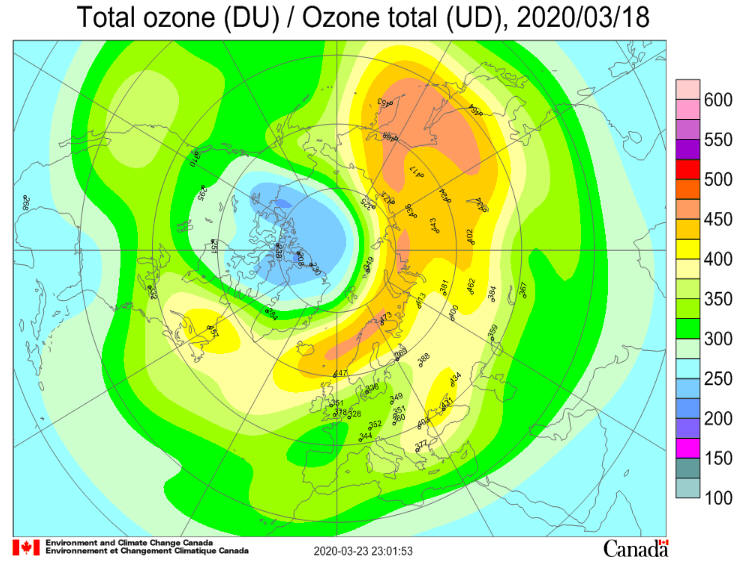
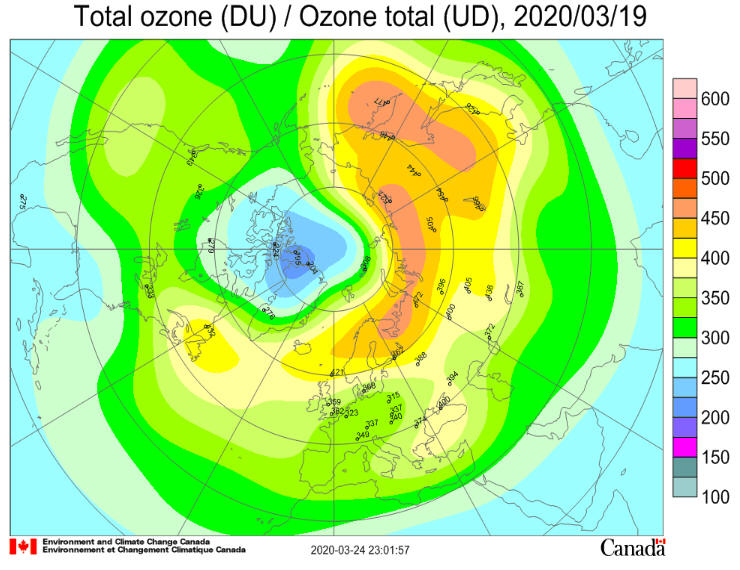
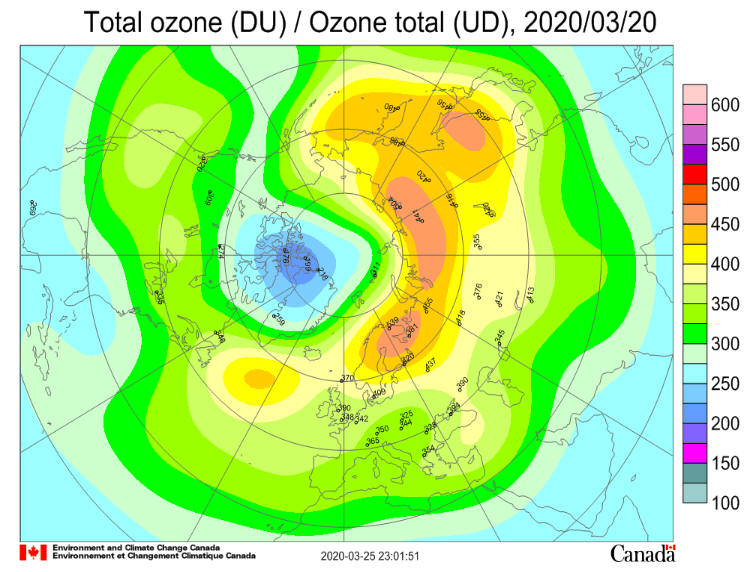
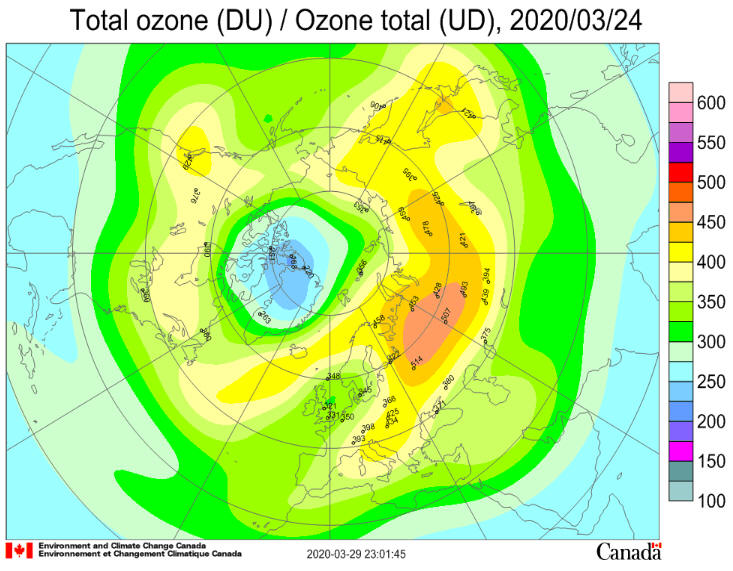
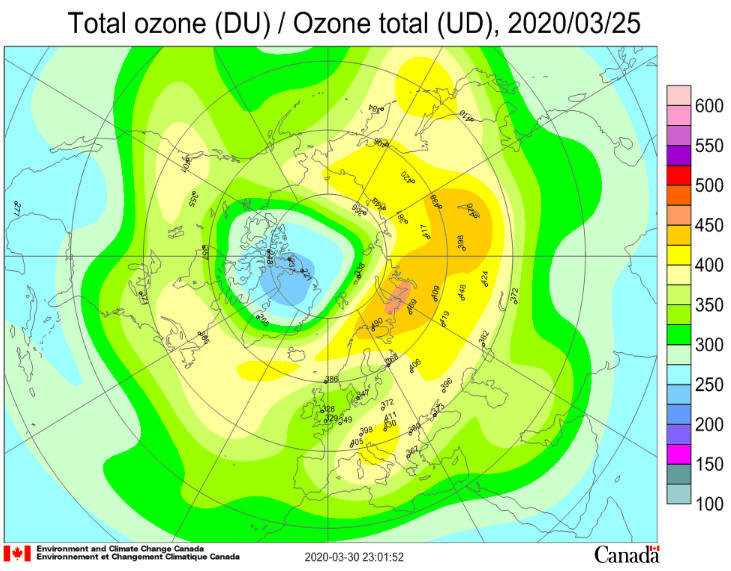
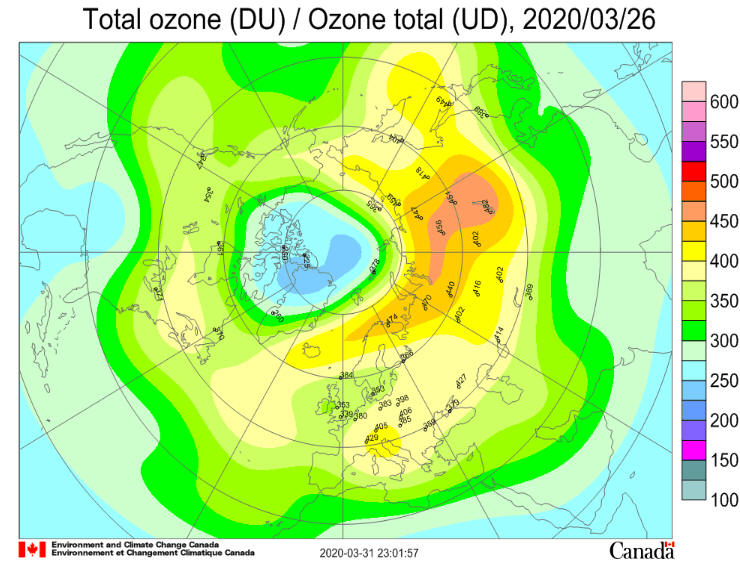
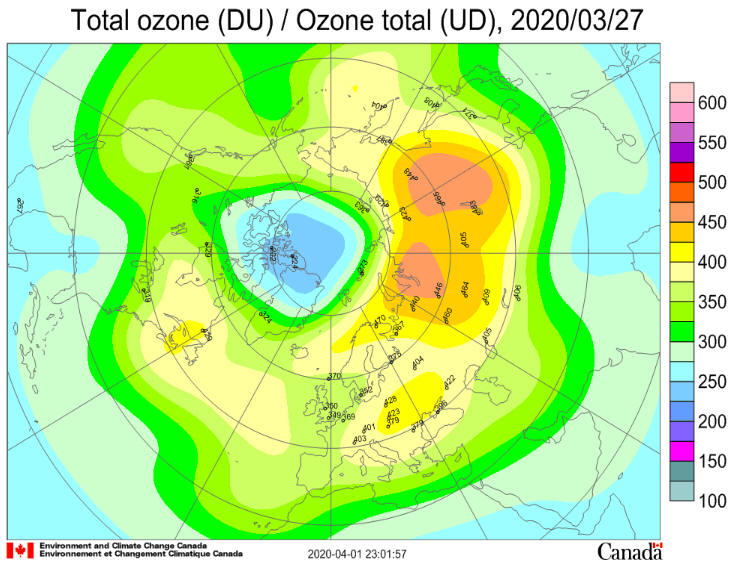
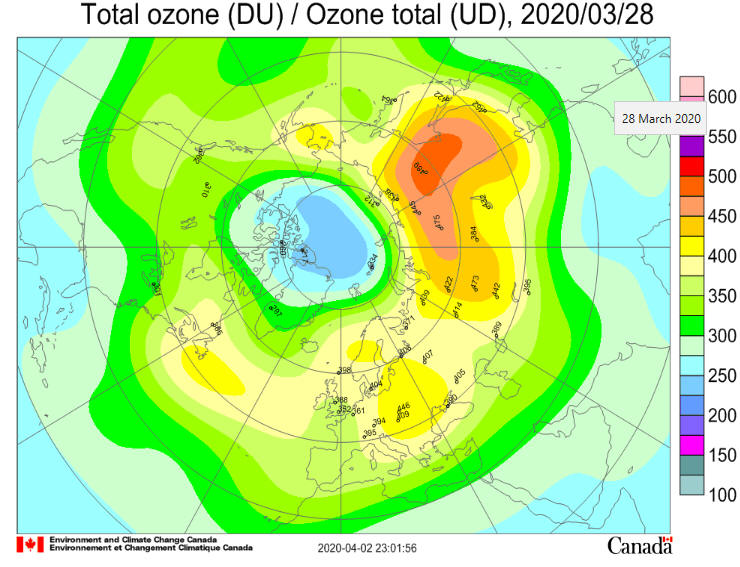
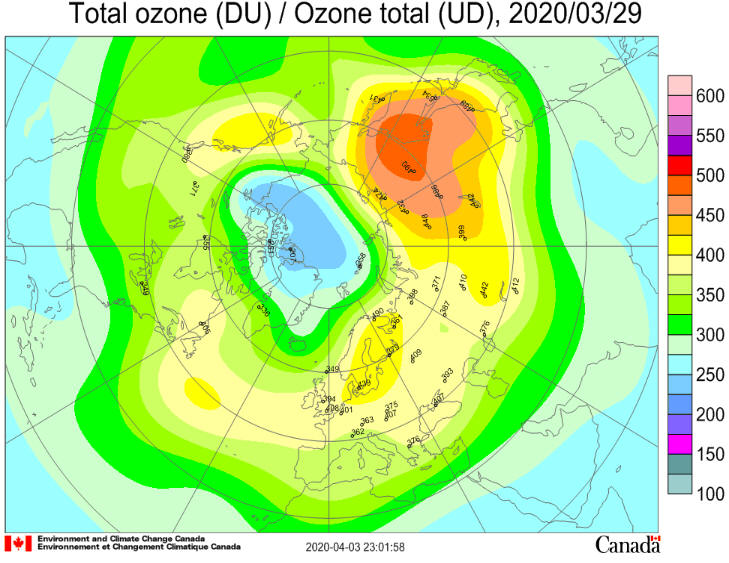
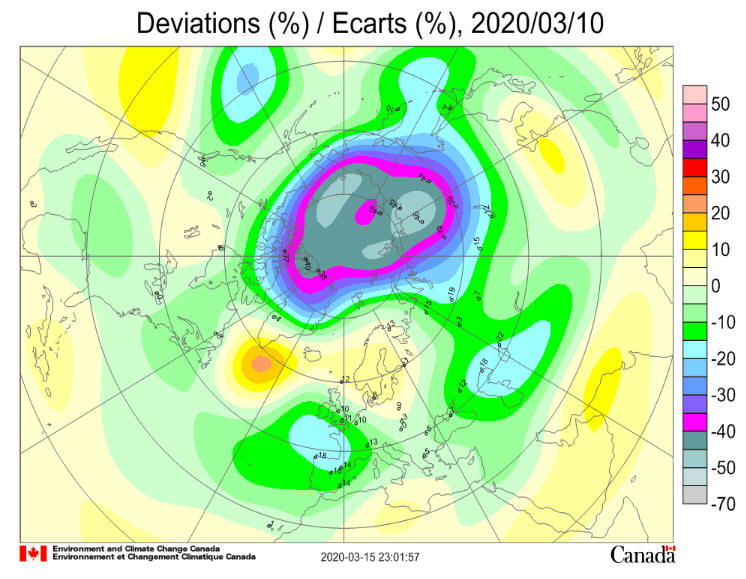
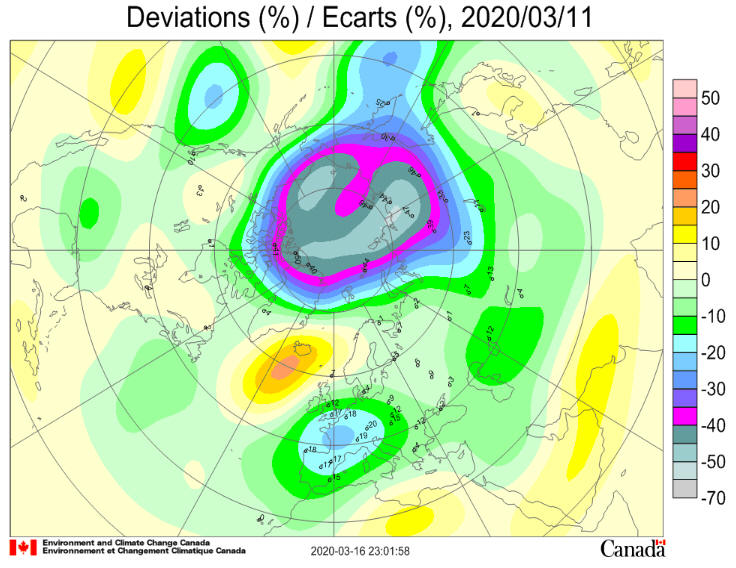
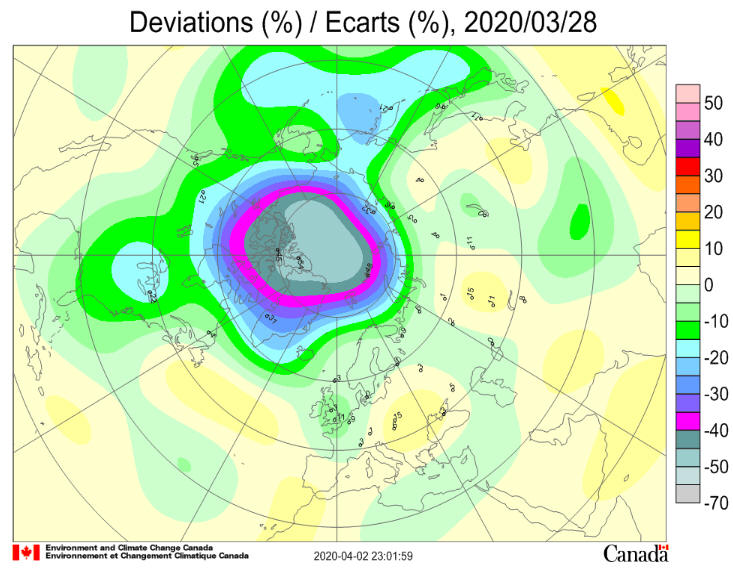
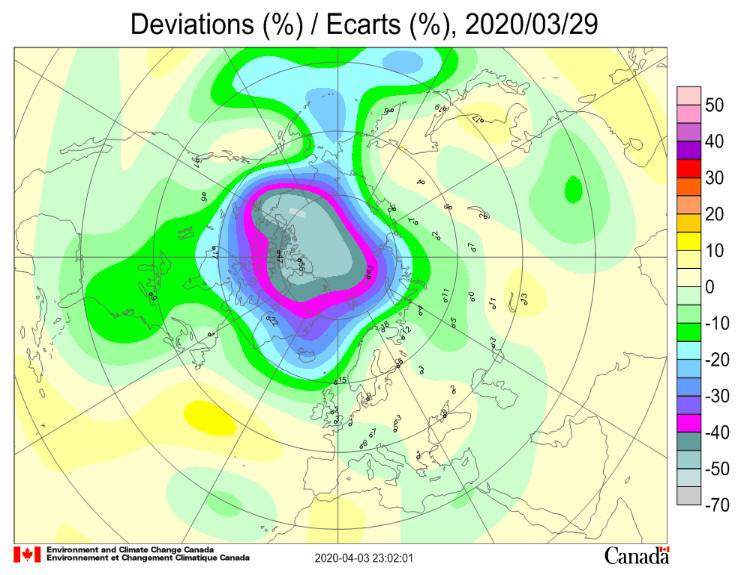
In 2020, ozone concentrations above the Arctic reached a record low for the month of March. In an analysis of satellite observations, scientists found that stratospheric ozone levels reached their lowest point—205 Dobson Units—on March 12, 2020. For comparison, the lowest ozone value observed over the Arctic in a typical March is at least 240 Dobson Units. While such low levels are unusual, they are not unprecedented in four decades of observations. Similar low ozone levels occurred in the Arctic stratosphere in 1997 and 2011. Such “low” levels for the Arctic are still nearly double the levels found in Antarctic ozone holes. “Low Arctic ozone like we had this year happens about once per decade,” said Paul Newman, chief scientist for Earth sciences at NASA’s Goddard Space Flight Center and an ozone layer expert. ”For the overall health of the ozone layer, this is concerning since Arctic ozone levels are typically high during March and April.” The images above show monthly average concentrations of ozone over the Arctic in March 2019 (a typical year) and March 2020, as calculated by the NASA Ozone Watch team. The plot below shows the daily minimum column ozone levels for the past two years and the long-term averages.
In 2020, ozone concentrations above the Arctic reached a record low for the month of March. In an analysis of satellite observations, scientists found that stratospheric ozone levels reached their lowest point—205 Dobson Units—on March 12, 2020. For comparison, the lowest ozone value observed over the Arctic in a typical March is at least 240 Dobson Units. While such low levels are unusual, they are not unprecedented in four decades of observations. Similar low ozone levels occurred in the Arctic stratosphere in 1997 and 2011. Such “low” levels for the Arctic are still nearly double the levels found in Antarctic ozone holes. “Low Arctic ozone like we had this year happens about once per decade,” said Paul Newman, chief scientist for Earth sciences at NASA’s Goddard Space Flight Center and an ozone layer expert. ”For the overall health of the ozone layer, this is concerning since Arctic ozone levels are typically high during March and April.” The images above show monthly average concentrations of ozone over the Arctic in March 2019 (a typical year) and March 2020, as calculated by the NASA Ozone Watch team. The plot below shows the daily minimum column ozone levels for the past two years and the long-term averages.
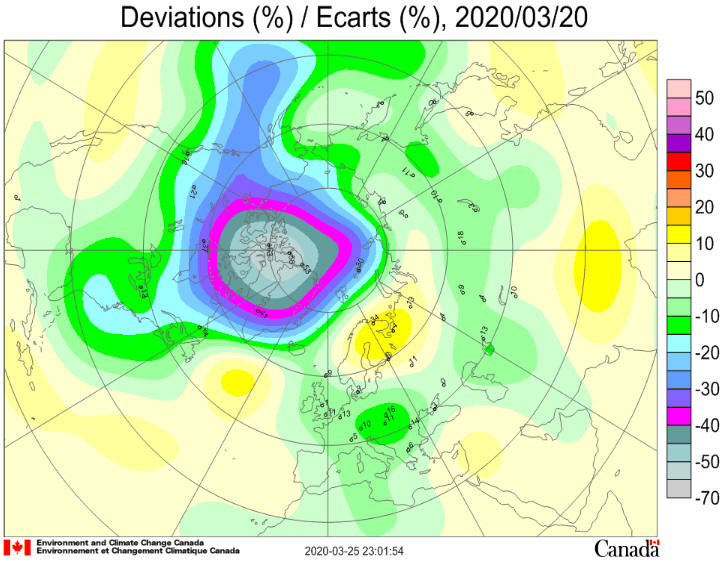
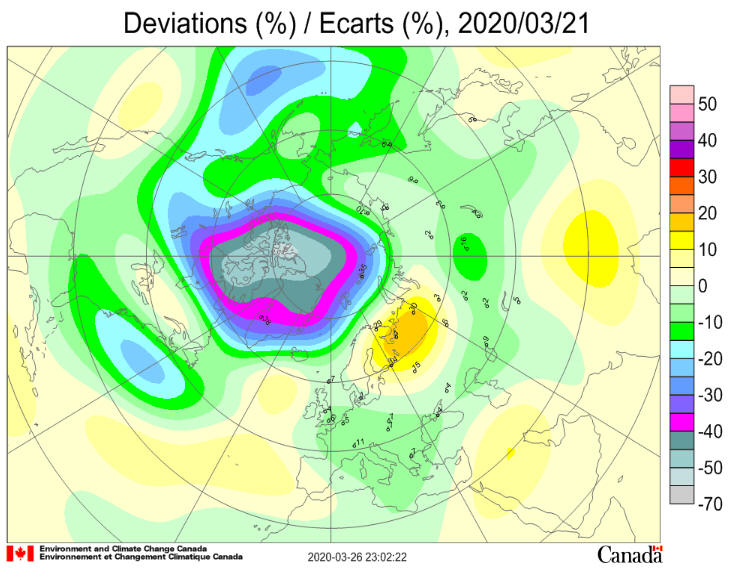
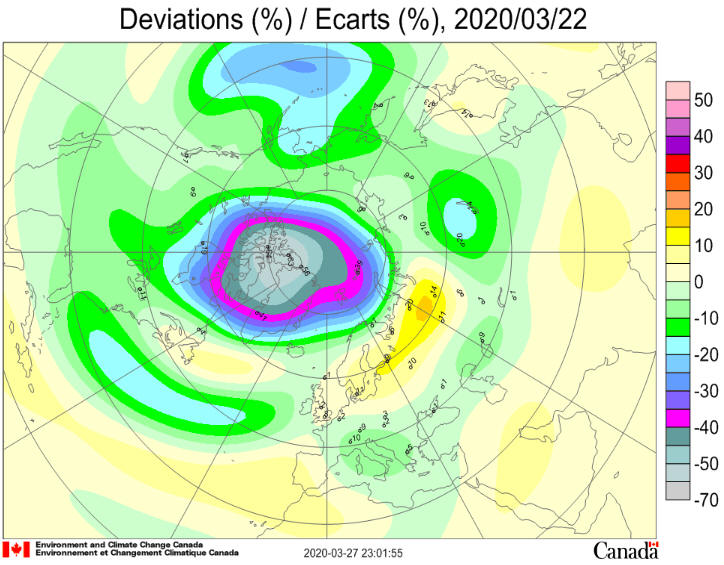
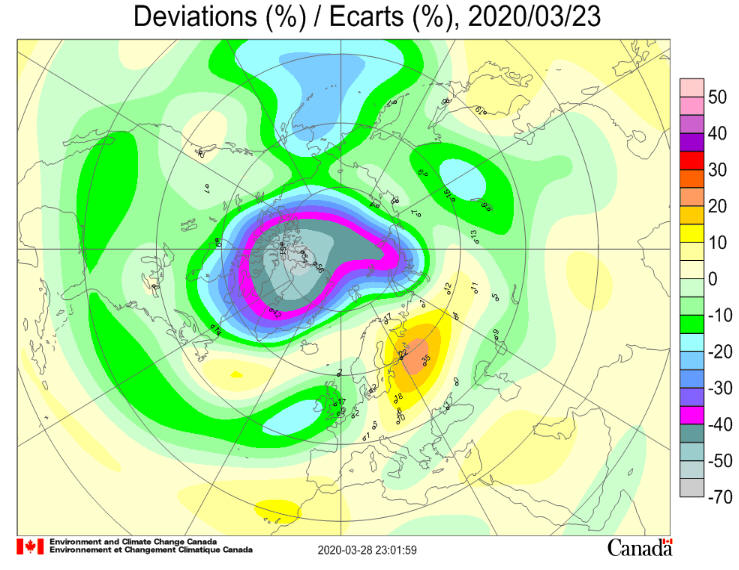
Ozone is a highly reactive molecule comprised of three oxygen atoms; it occurs naturally in small amounts. The stratospheric ozone layer—roughly 10 to 40 kilometers (7 to 25 miles) above Earth’s surface—is a natural sunscreen, absorbing harmful ultraviolet radiation that would otherwise damage plant DNA and harm humans and animals by causing cataracts, skin cancer, and suppressed immune systems. This year’s Arctic ozone depletion was caused by unusually weak upper atmospheric “wave” events from December 2019 through March 2020. These waves drive masses of air through the upper atmosphere, much like weather fronts in the lower atmosphere, but much bigger in scale. In a typical year, these waves travel upward from the lower atmosphere in middle latitudes and disrupt the circumpolar winds that swirl around the Arctic. When such waves disrupt polar winds, they bring ozone from other parts of the stratosphere and replenish the reservoir over the Arctic. “Think of it like having a red-paint dollop—low ozone over the North Pole—in a bucket of white paint,” Newman said. “The waves stir the white paint—higher amounts of ozone in the mid-latitudes—with the red paint (or low ozone) contained by the strong jet stream circling around the pole.” This mixing has a second effect: warming the air over the Arctic. Warmer temperatures then make conditions unfavorable for the formation of polar stratospheric clouds, which are known to promote ozone-depleting reactions by releasing chlorine. Most of the chlorine and bromine in the atmosphere comes from chlorofluorocarbons and halons, the chemically active forms of chlorine and bromine that were once used in refrigerants, foams, and aerosol-spray cans and are now banned by the Montreal Protocol. Upper atmospheric mixing usually shuts down chlorine- and bromine-driven ozone depletion. From December 2019 through March 2020, however, stratospheric wave events were weak and did not disrupt the circumpolar winds. The winds thus acted like a barrier, preventing ozone from other parts of the atmosphere from replenishing ozone levels over the Arctic. The stratosphere also remained cold in the region, leading to the formation of the polar stratospheric clouds that provoke ozone-depleting reactions. NASA researchers prefer the term “depletion” for the Arctic since the ozone loss is still much less than the ozone “hole” that forms over Antarctica each September and October. For comparison, ozone levels over Antarctica typically drop to about 120 Dobson Units. The animation above shows the concentrations of ozone over the North Pole from August 1, 2019, to March 31, 2020. The smaller inset shows conditions over the South Pole, which tend to be much more extreme. “We don’t know what caused the wave dynamics to be weak this year,” Newman said. “But we do know that if we hadn’t stopped putting chlorofluorocarbons into the atmosphere because of the Montreal Protocol, the Arctic depletion t
NASA Earth Observatory images and video by Joshua Stevens, using data courtesy of NASA Ozone Watch. Story by Ellen Gray, NASA Earth Science News Team, with Michael Carlowicz.
|