|
The Ozone Hole 1994
http://ozonewatch.gsfc.nasa.gov
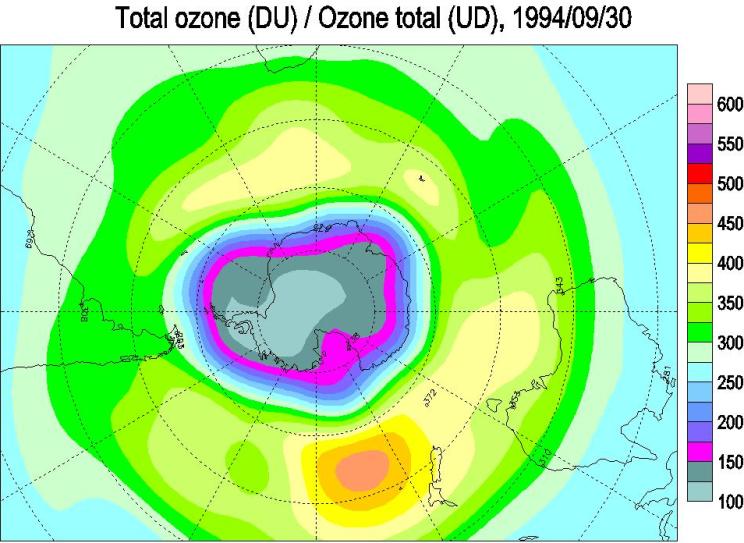
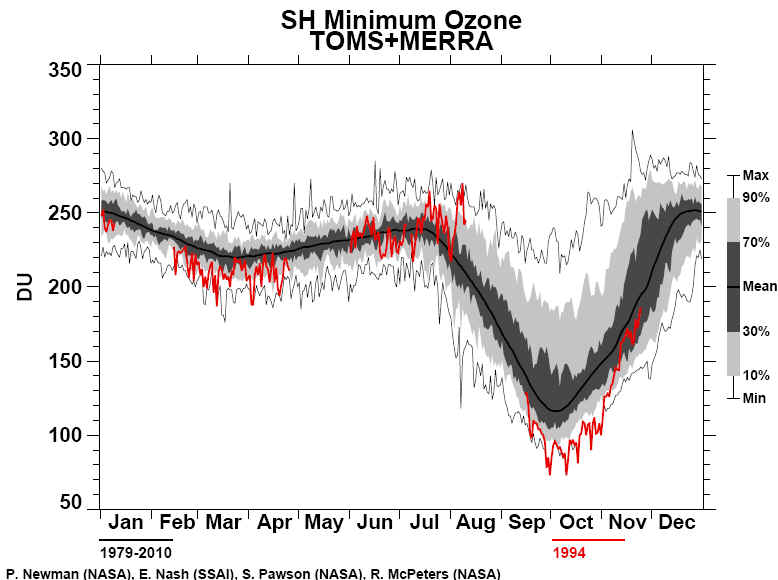
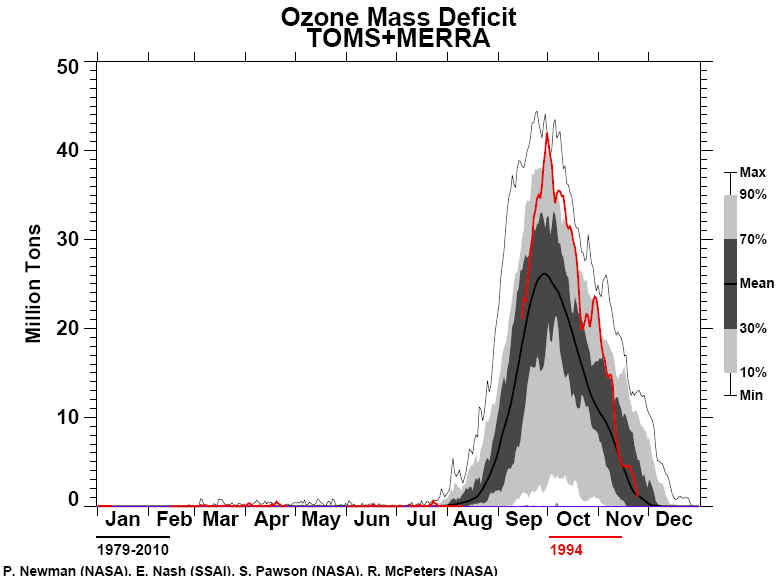
The development of the 1994 springtime (September–November) Antarctic ozone hole
was observed by the Meteor‐3/TOMS (Total Ozone Mapping Spectrometer) to result
in a very low minimum ozone value, 90±5 DU (Dobson Units) on September 28, 1994.
During late September and early October, the region of extremely low ozone
values was centered on the geographical pole between 85°S and 90°S. The
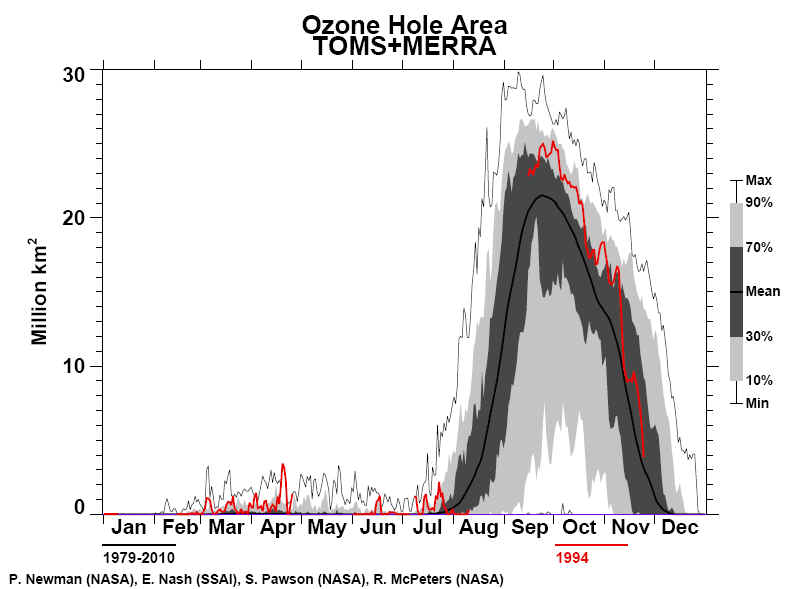
geographical extent of the ozone hole region, the area within the 220 DU
contour, reached a maximum during the first week in October with an elliptical
area covering 24 × 106 km², reaching to the southern tip of
South America. This approximately matched previous area records. After the
maximum area was reached in early October, the 1994 ozone hole region was very
similar to the 1993 ozone hole throughout the remainder of the month. The area
of low temperatures (<196 K), where polar stratospheric clouds (PSCs) can form
and heterogeneous chemistry is significant, has not increased over the past 16
years. During this period, the large trends in the area and minimum ozone
amounts of the Antarctic ozone hole do not appear to be related to atmospheric
temperature trends.
British Antarctic Survey summary 1994-Preliminary mean ozone values from Faraday show that mean ozone values at the end of the winter were around 290 DU dropping to a minimum of around 160 DU by mid October (55% depletion). This is the steepest decline recorded at this station, and the minimum mean values were about 40 DU below those at the same time last year. The mean for September is the lowest September mean recorded at the station; 133 DU recorded at the end of the month is the lowest ever September mean daily value. Individual values of 130 DU in early October represent nearly 65% depletion and are the second lowest on record for the station. A strong spring warming episode occurred between October 20th and 28th, with a very rapid rise to 400 DU on October 22nd; this is the earliest the warming has occurred for several years and is also the steepest rise (some 250 DU in three days). Following the event mean values dropped to 180 DU (50% depletion), and then slowly rose again, reaching 230 DU by November 23rd. The final spring warming occurred between November 21st and 23rd with mean ozone values rising rapidly to around 340 DU by the end of November. The November monthly mean is the second lowest on record. Values in early December were near normal at around 360 DU, but were generally below normal throughout the late summer and autumn. Preliminary ozone measurements from Halley show that mean ozone values dropped from around 180 DU at the end of August to 105 DU in early October (65% depletion), then slowly rose to reach 160 DU by November 7th. A minor peak occurred between November 7th and 17th, with a maximum of 230 DU on the 11th, followed by a decline to 185 DU. The spring warming commenced on November 24th with ozone levels peaking at around 350 DU in late November and then slowly declining. The monthly means for September and October are between those of 1992 and 1993. Mean values throughout the summer and autumn were significantly below those of the long term mean and throughout the season no daily values exceeded those of the long term mean. The data from 1956 - 1994 suggest that the mean for October 1995 will be around 120 DU, with minimum values below 100 DU. The temperature at 100 hPa rose slowly from the winter value of around -82 deg C in early October to reach -67 deg C by November 22nd (some 15 degrees below normal). The final warming then took place with the temperature reaching near normal values of around -40 deg C by the end of the month. The temperature then slowly declined, reaching -60 deg C by the end of April. The ozone values from Halley and Faraday are consistent with a hole of greater maximum extent than in 1993, but slightly shallower. NASA GSFC images from Meteor-3/TOMS and radiosonde data suggest that the edge of the hole was over the tip of South America and the Falkland Islands between October 11th and 21st, and was close to the region between October 29th and November 13th. The Falkland Islands now consider the ozone hole a major threat to health following cases of severe sunburn during this event.
|
||||||||||||||||||||||||