|
The Ozone Hole 2001
http://ozonewatch.gsfc.nasa.gov
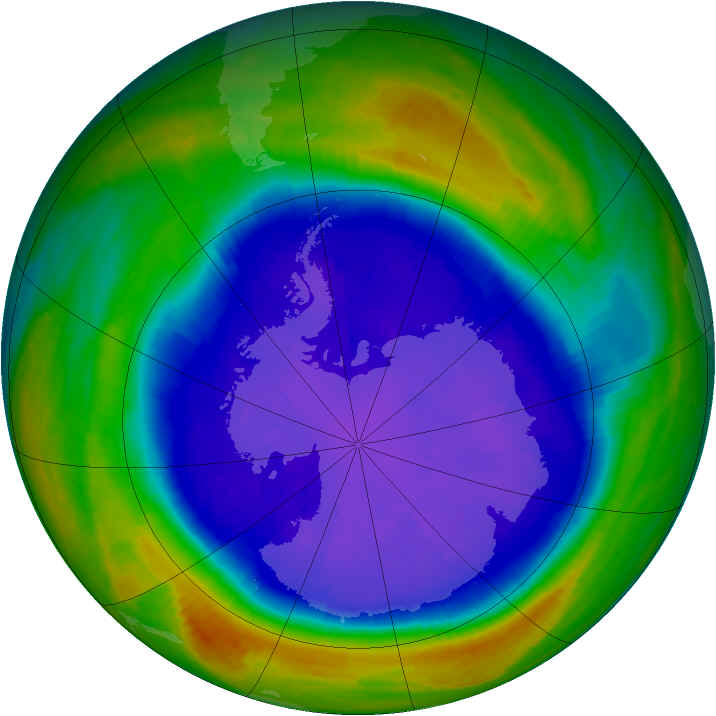
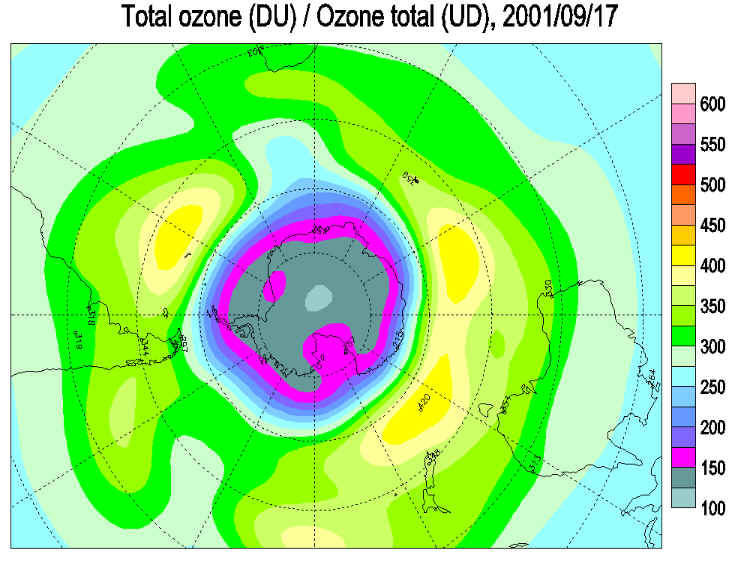
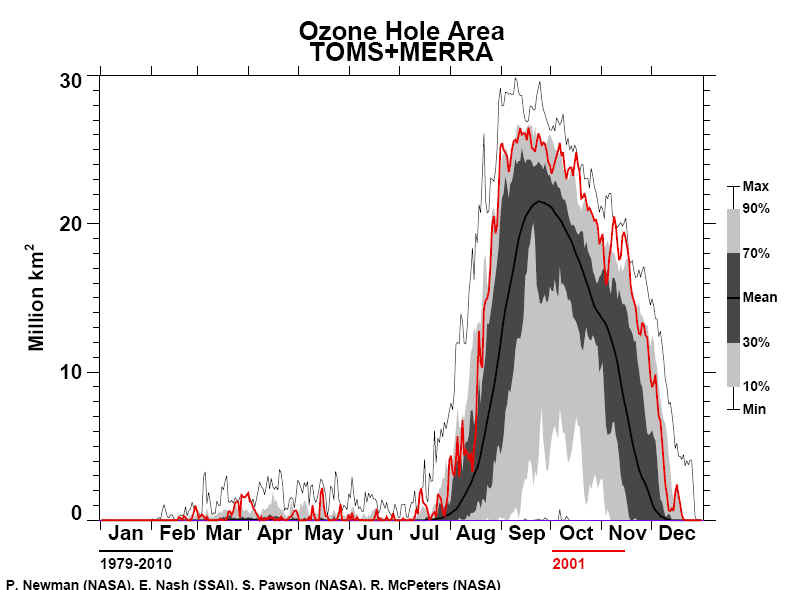
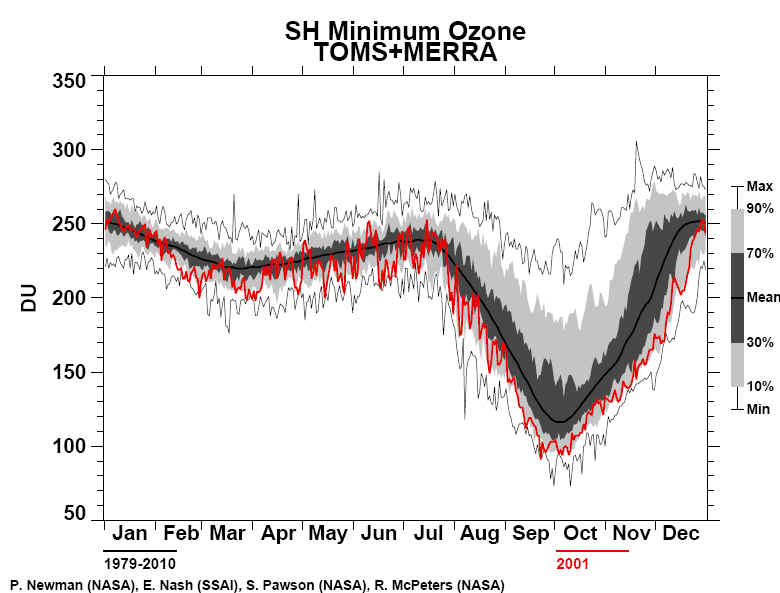
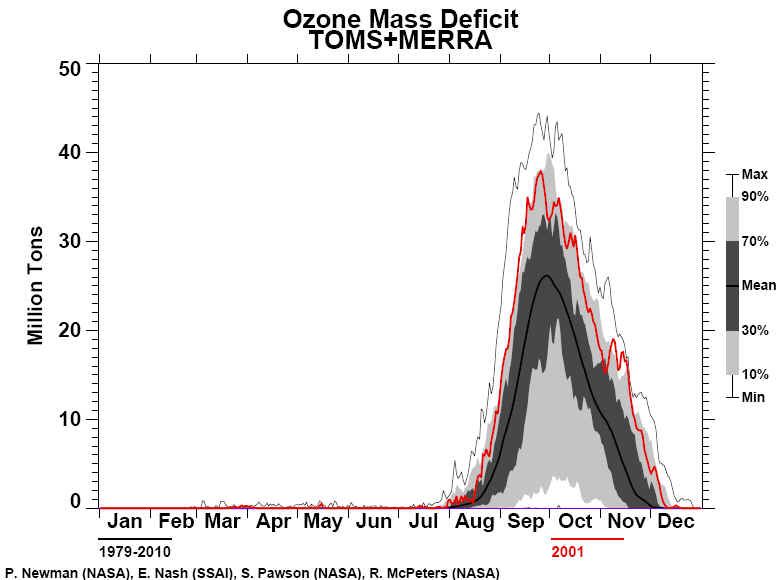
British Antarctic Survey summary-In 2001 the ozone hole reached an area of over 25 million square kilometres at its maximum in September, and lasted until the summer solstice. Once the hole had gone, ozone levels at Halley remained some 12% below the normal for the time of year. The temperature at the level of the ozone layer (100 hPa temperature) also substantially below the normal for the time of year. Some early Halley observations using moonlight gave total ozone values around 220 DU at the beginning of August, a depletion of about 25%. In September values dropped from around 180 DU at the beginning of the month at around 2 DU per day. From the equinox to late October values were around 125 DU, which is 60% below the normal. The minimum daily mean value recorded this year was 116 DU. Mean values rose to around 270 DU in November, but dropped back to around 240 DU in mid December. They then rose to reach 300 DU (12% below the normal) by early January. The 100 hPa temperature at Halley (at -45°C) remains significantly below the normal (-40°C). It rose rapidly from around -80°C in late October to reach -46°C at the solstice. There was a standstill at -60°C in late November and early December. It was a few degrees below the normal for most of the first half of 2001, except for a short period between mid March and the end of April. Satellite imagery gives a global perspective on the ozone hole. Our 2001/2002 Antarctic ozone hole movie is produced from TOMS images. A low ozone event with central values below 200 DU occurred on the edge of the sunlit polar vortex between June 15 and June 28. The hole developed and reached over 25 million square kilometres in mid September. By early December it had shrunk to 7 million square kilometres, with minimum values still below 200 DU. It disappeared at the solstice. Ozone values in the temperate high ozone belt are now declining after the spring maximum. The edge of the ozone hole passed over the tip of South America, the Falkland Islands and South Georgia during the period from October 15 to 26. National Oceanic and Atmospheric Administration summary-Very low ozone values were observed over Antarctica again in 2001. Ozone depletion of 10 percent to more than 40 percent was observed over Antarctica compared to total ozone amounts observed in the early 1980's. Vertical soundings over the South Pole during late September and early October 2001 again showed complete destruction of ozone at altitudes between 15 and 20 km. Lower stratosphere temperatures in the winter and spring of 2001 over the Antarctic region were below average values, and were sufficiently low for ozone production of polar stratospheric clouds within the polar vortex. The ozone hole area and the PSC area were again among the largest of all previous years. For the year 2001, the ozone hole and Southern Hemisphere polar vortex persisted into December, again among the longest duration of years since 1982. Observations of chloroflourocarbons and of stratospheric hydrogen chloride support the view that international actions are reducing the use and release of ozone depleting substances . However, chemicals already in the atmosphere are expected to continue to deplete ozone for many decades to come. Further, changing atmospheric conditions that modulate ozone can complicate the task of detecting the start of ozone layer recovery. The eruption of the Pinatubo volcano provided an example of such a complication in the 1990s. Based on an analysis of 10 years of South Pole ozone vertical profile measurements, estimated that recovery in the Antarctic ozone hole may be detected as early as the coming decade. Indicators include: 1) an end to springtime ozone depletion at 22-24 km, 2) 12-20 km mid-September column ozone loss rate of less than 3 DU per day, and 3) a 12-20 km ozone column of more than 70 DU on September 15. However, an intriguing aspect of recent observations of the Antarctic stratosphere is the apparent trend towards a later breakup of the vortex. A full explanation of such meteorological anomalies is not yet available. Continued monitoring and measurements, including total ozone and its vertical profile, are essential to achieving the understanding needed to identify ozone recovery. http://www.cpc.ncep.noaa.gov/products/stratosphere/winter_bulletins/sh_01/index.html NOAA, NASA REPORT
2001 OZONE HOLE SIMILAR IN SIZE TO HOLES OF October 16, 2001 — NOAA and NASA scientists report that satellite data show the area of the Antarctic ozone hole peaked at about 26 million square kilometers (about 10 million square miles), making this year's ozone hole the same size as North America, and similar in size to those of the past three years. Over the past several years the annual ozone hole over Antarctica has remained roughly the same in both area and minimum total column ozone amount. "This is consistent with human-produced chlorine compounds that destroy ozone reaching their peak concentrations in the atmosphere, leveling off, and now beginning a very slow decline," said NOAA scientist Samuel Oltmans. In the near future (barring unusual events such as explosive volcanic eruptions) the severity of the ozone hole will likely remain similar to what has been seen in recent years with year-to-year differences associated with meteorological variability. Over the longer term (30-50 years) the severity of the ozone hole in Antarctica is expected to decrease as chlorine levels in the atmosphere decline. The total area of the ozone hole is one measure of its severity. The ozone hole area is defined as the size of the region with total ozone below 220 Dobson units. A Dobson unit is a unit of measurement that describes the thickness of the ozone layer in a column directly above the location being measured. Prior to the springtime period in Antarctica, when ozone depletion occurs, the normal ozone reading is around 275 Dobson units. "Last year the ozone hole was of record size, but it formed very early and then collapsed quickly," said NASA scientist R.D. McPeters. "This year the hole was about 10 percent smaller." Data from NOAA's polar-orbiting
operational environmental satellites and estimates of the area made by NASA
scientists using measurements from the Total Ozone Mapping Spectrometer (EPTOMS)
aboard NASA's Earth Probe satellite give similar sizes. Using instrumented balloons to make ozone profile measurements at the South Pole, researchers from NOAA reported that the September decline in ozone was similar to recent years with almost all of the ozone in the 15 - 20 kilometer (9-12 mile) altitude region destroyed." Total column ozone over the South Pole reached a minimum reading of 100 Dobson units on Sept. 28, 2001, compared to a minimum of 98 Dobson units in 2000," said Bryan Johnson, a scientist with NOAA's Climate Monitoring and Diagnostics Laboratory in Boulder, Colo. The record low of 88 Dobson units was observed in 1993. "The severity of the ozone depletion within the hole reached about the same levels as the past few years and the highly depleted region filled about three-fourths of the Antarctic polar vortex," said Jim Miller, a scientist with NOAA's Climate Prediction Center in Camp Springs, Md." This year the vortex has been more stable and somewhat colder than average." Year-to-year fluctuations in the geographical size of the polar vortex and the size of the region with low temperatures will alter the size of the ozone hole over the next decade during the period that levels of ozone-destroying chemicals in the atmosphere begin a slow decline. The amount of chlorine in the stratosphere from CFCs has reached a maximum due to regulations on emissions as dictated by the Montreal Protocol on substances that deplete the ozone layer and subsequent amendments. NOAA and NASA scientists report that this year's ozone hole is not cause for alarm, and is within the bounds of what was expected. The thinning of the ozone layer is a matter of concern because the ozone layer protects the Earth from the harmful effects of the sun's ultraviolet radiation, which affects life on Earth and contributes to skin cancer and cataracts in humans. Total recovery of the ozone hole back to levels observed before 1980 will take at least 50 years, and expected changes in climate, including a cooler stratosphere, could cause a delay in the recovery of the ozone layer. NASA and NOAA satellite instruments have been measuring Antarctic ozone levels for more than 20 years. Continued monitoring by satellite instruments over the next two months will establish how long-lived the current year's ozone hole will be, and a summary report will be issued by NOAA in December. NOAA is dedicated to enhancing economic security and national safety through the prediction and research of weather and climate-related events and providing environmental stewardship of our nation's coastal and marine resources. Relevant Web Sites NOAA's Climate Monitoring and Diagnostics Laboratory NOAA's Polar-orbiting Operational Environmental Satellites NOAA's Climate Prediction Center NASA's Total Ozone Mapping Spectrometer (TOMS) Media Contact:
|
||||||||||||||||||||||||||||