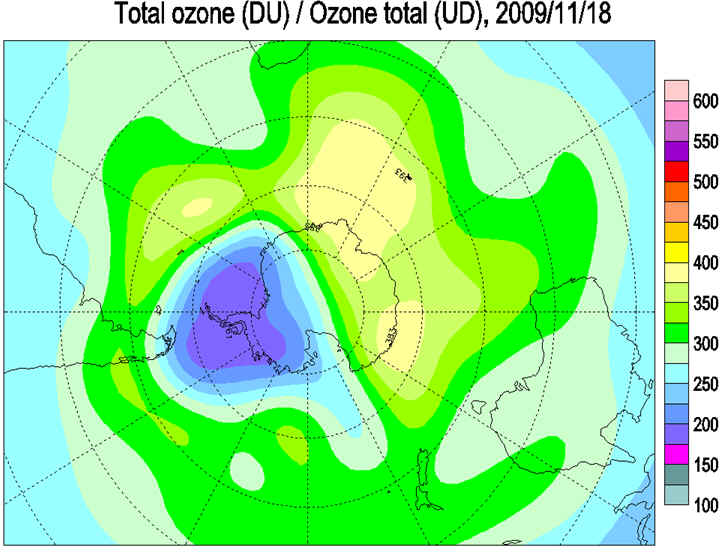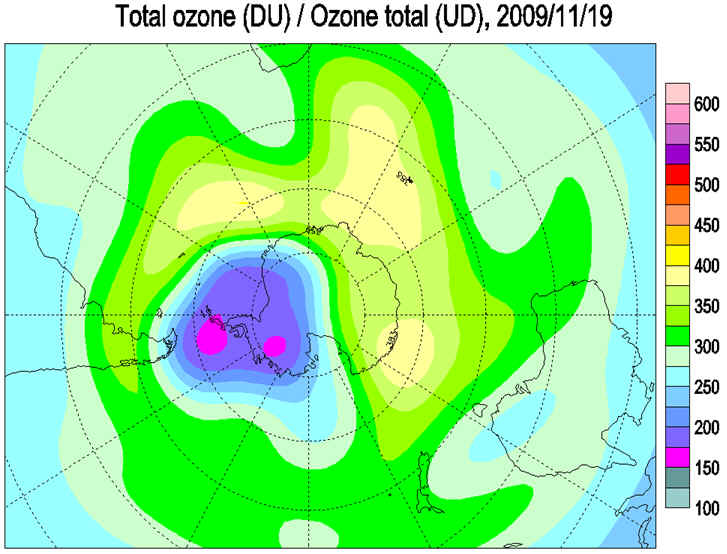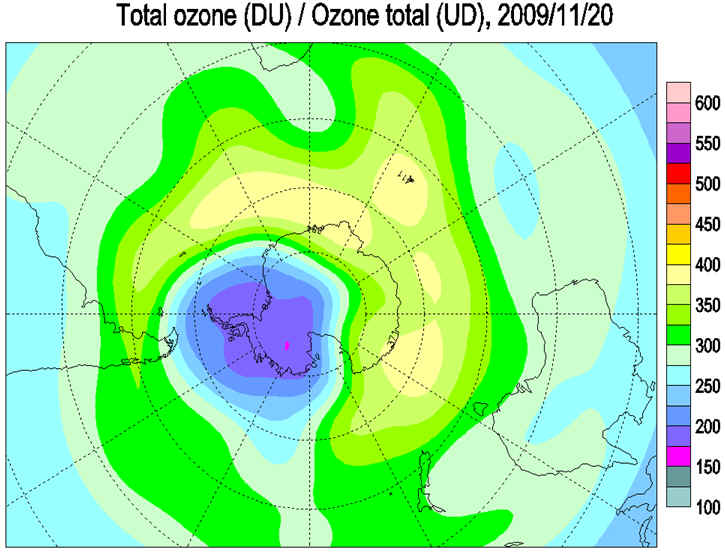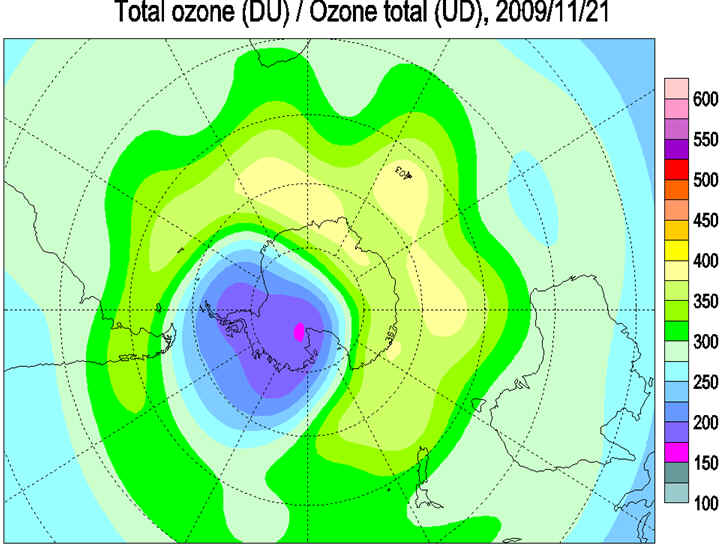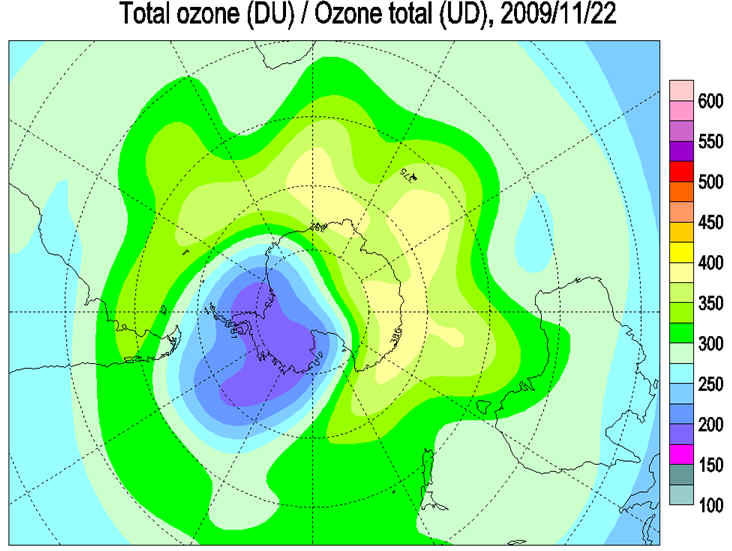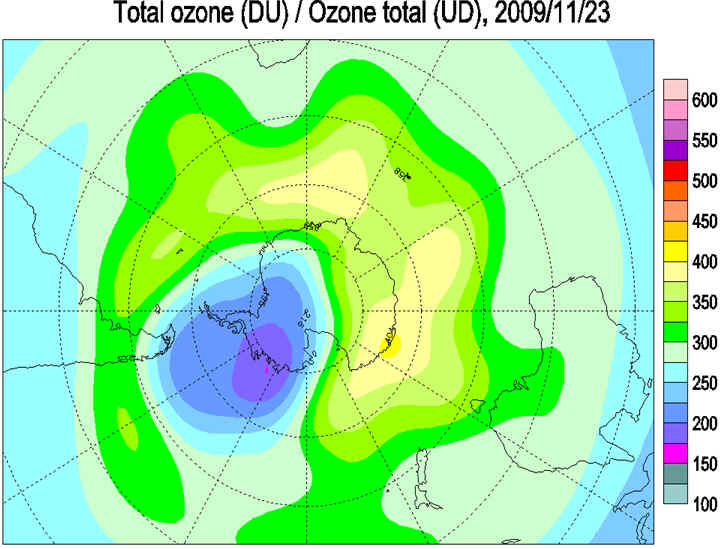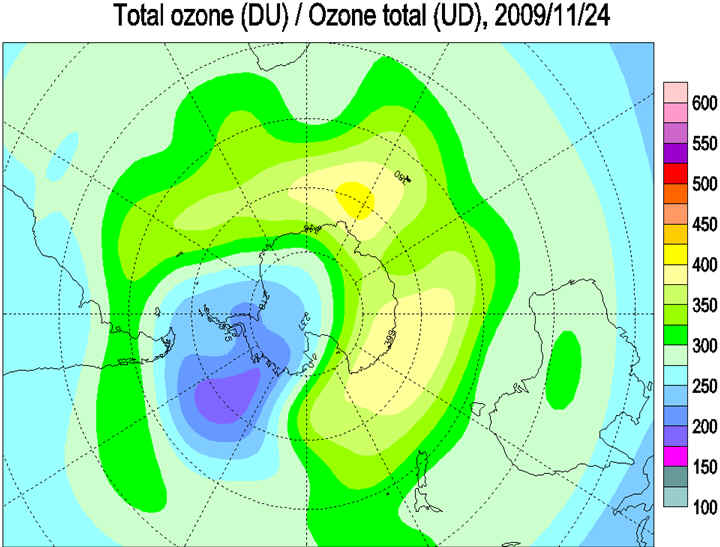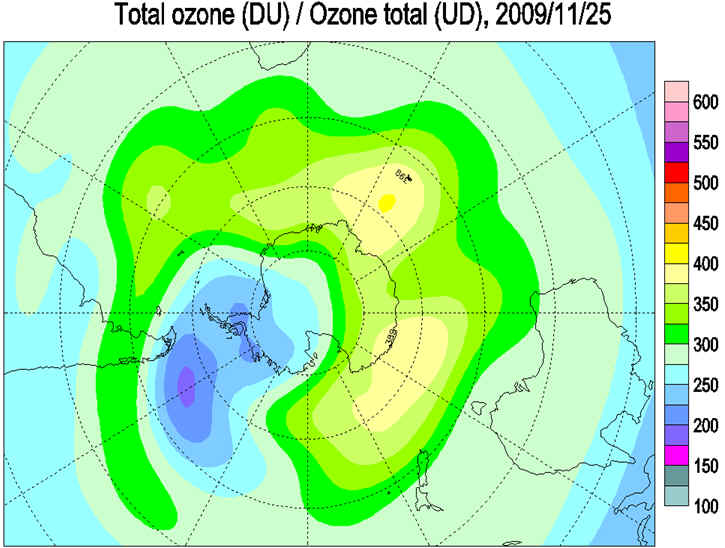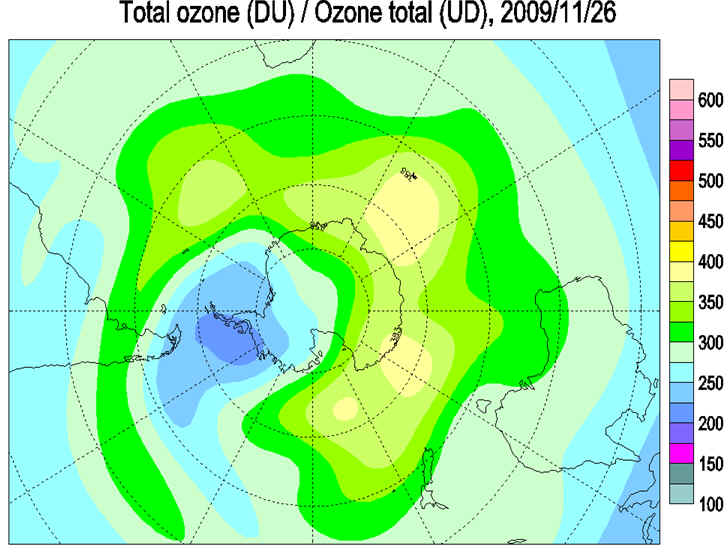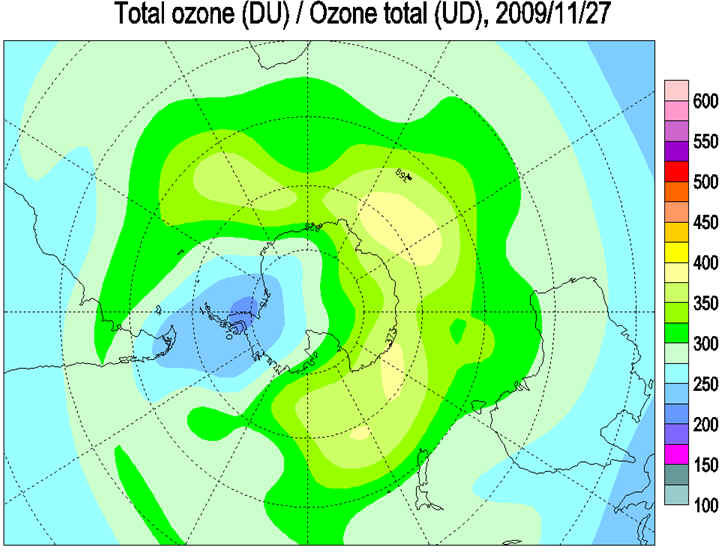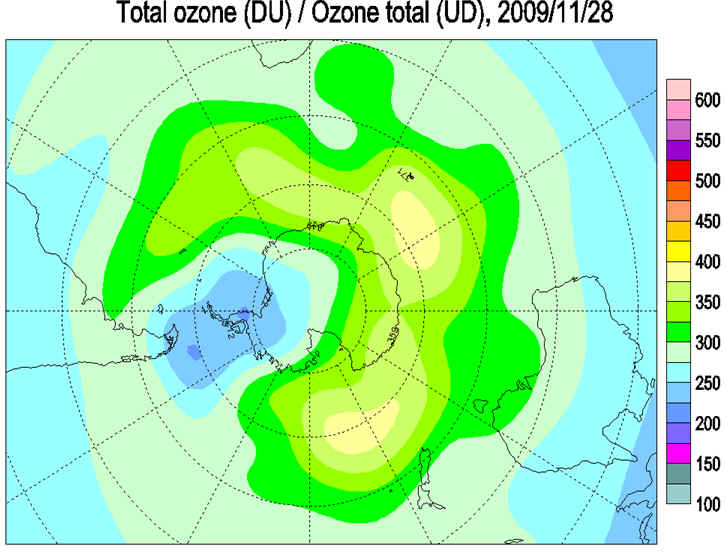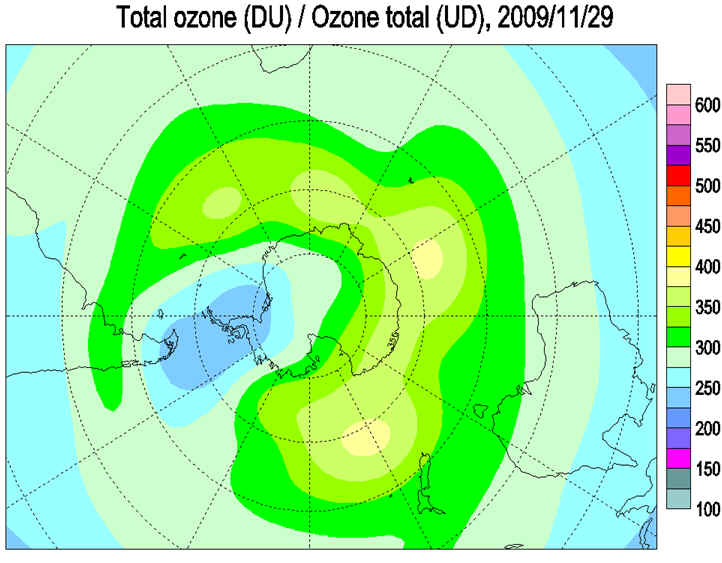
Wandering Ozone Hole in November 2009
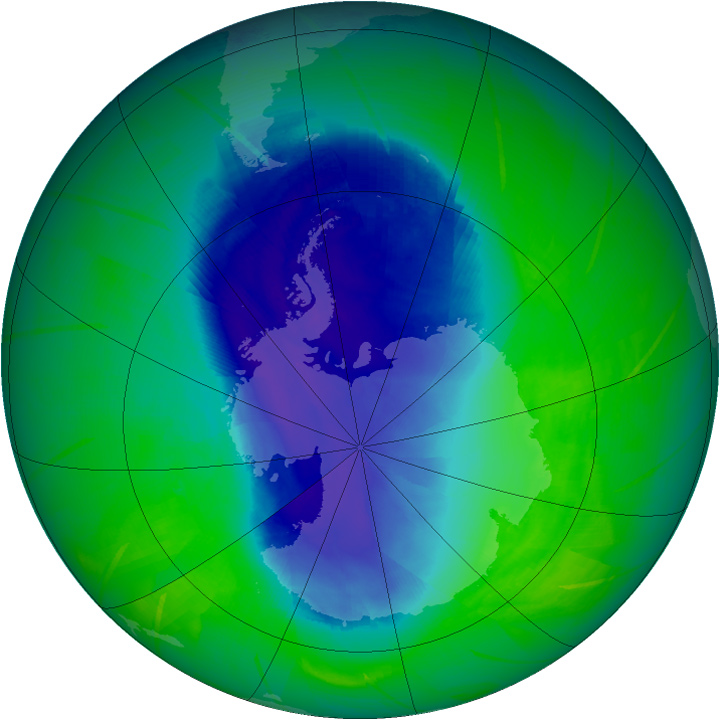
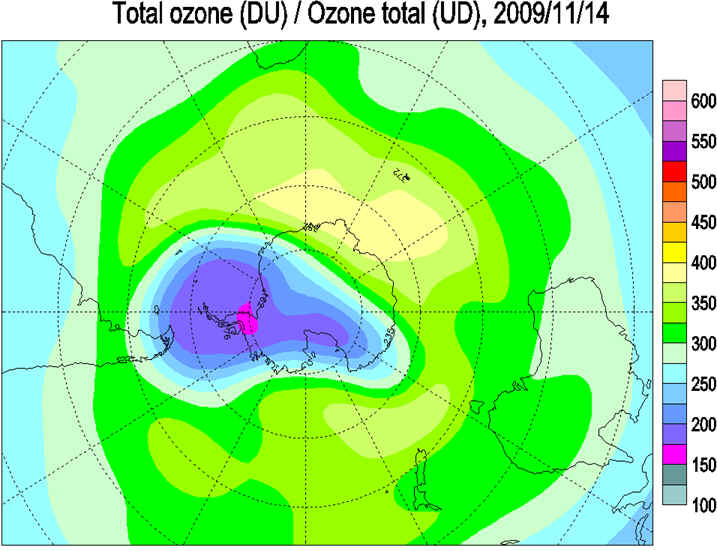
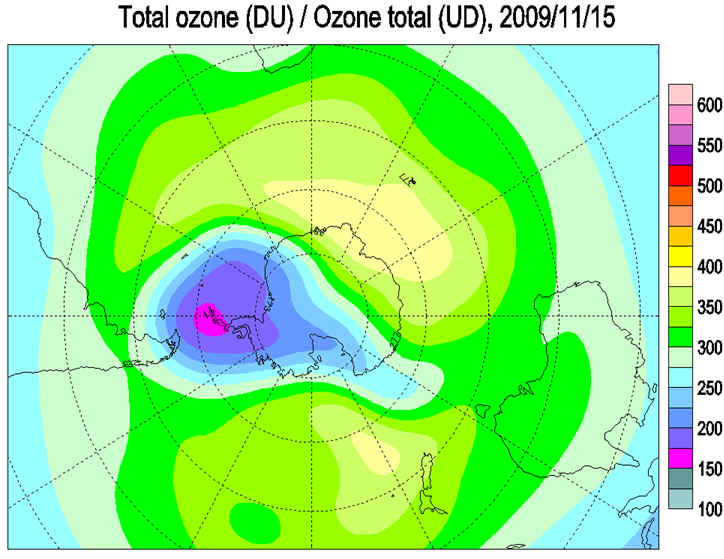
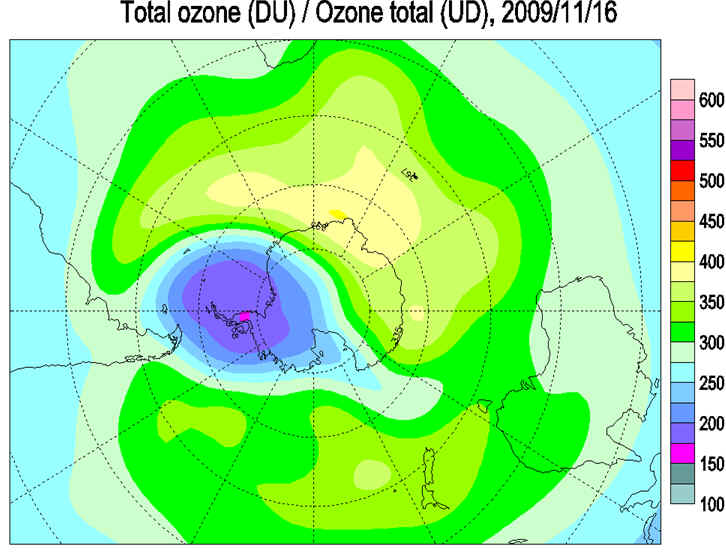
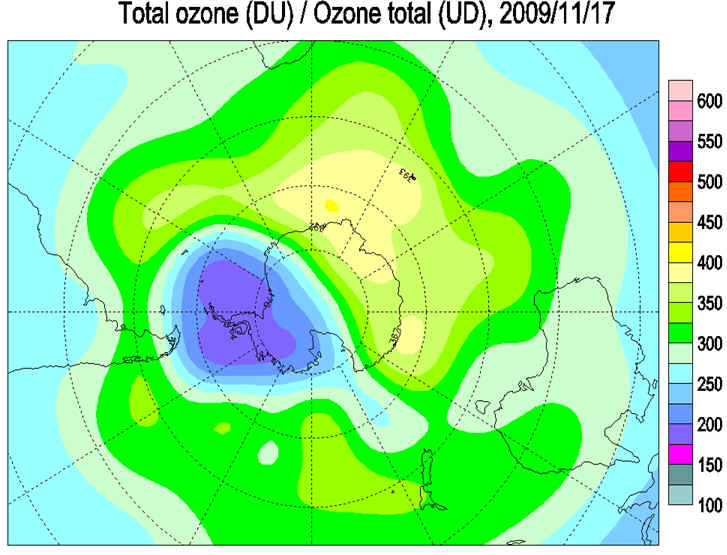
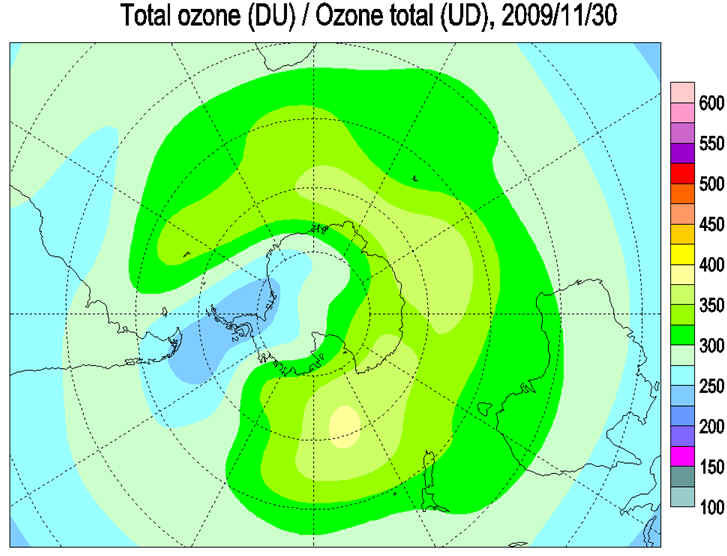
November 2, 2010-NASA Earth ObservatoryThe annual hole in the ozone layer over the South Pole is not static, nor is it necessarily symmetrical or circular. But in November 2009, the hole contorted and stretched itself for three weeks in such a way as to give South Americans an extra dose of ultraviolet (UV) radiation. This image—assembled from data from the Ozone Monitoring Instrument (OMI) on NASA’s Aura satellite—shows the Antarctic ozone hole as it appeared on November 13, 2009; the downloadable movie shows the entire month of November. The hole stretched into an oblong shape and persistently extended over the southern reaches of South America from November 11 to 30. Using measurements from ground stations and from satellites such as Aura, researchers led by Jos de Laat of the Royal Netherlands Meteorological Institute found that the ozone hole was centered just off the southern tip of Chile and Argentina for three weeks in November 2009, rather than its usual center over Antarctica. According to atmospheric scientist Paul Newman of NASA’s Goddard Space Flight Center, it is not necessarily the first time scientists have observed a hole stretching so far north or taking such an oblong shape. Variability in the shape, size, and duration of the annual ozone hole are determined mostly by temperature and wind patterns in the stratosphere. But the northward-shifted hole was unusually persistent in 2009, and it was the first time such a phenomenon has affected South America, according to de Laat et al. The event gave citizens of Tierra del Fuego and nearby regions nearly twice the normal dose of UV radiation for the area. The ozone layer is Earth’s natural sunscreen, absorbing and blocking most of the incoming UV radiation from the Sun and protecting life from DNA-damaging radiation. Ozone gas is naturally created and replenished by a chemical reaction in the upper atmosphere, where UV rays break oxygen molecules (O2) into individual atoms that then recombine into three-part molecules (O3). As it is moved around the globe by upper level winds, ozone is slowly depleted by naturally occurring atmospheric gases. NASA image courtesy Ozone Hole Watch. . Caption by Michael Carlowicz.
|