|
Questions and Answers About the Ozone Layer
What is ozone and where is it in the atmosphere?
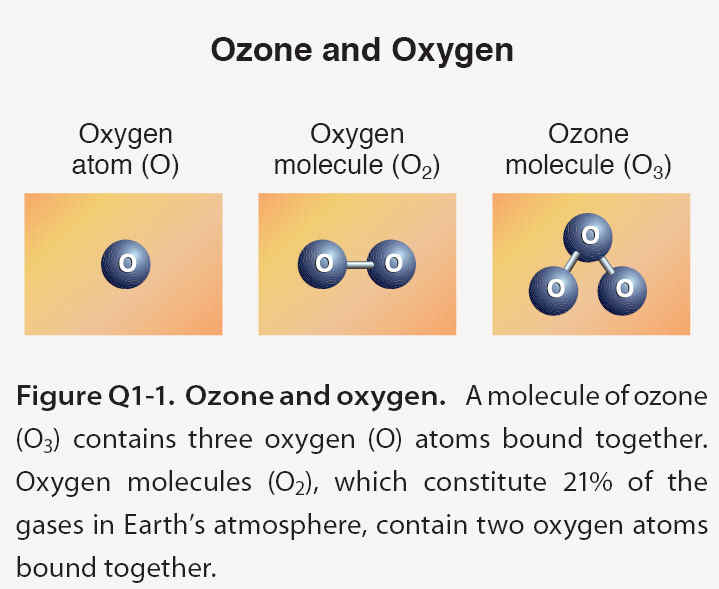
Ozone is a gas that is naturally present in our atmosphere. Ozone has the chemical formula O3 because an ozone molecule contains three oxygen atoms . Ozone was discovered in laboratory experiments in the mid- 1800s. Ozonefs presence in the atmosphere was later discovered using chemical and optical measurement methods. The word ozone is derived from the Greek word oζειν (ozein),, meaning to smell. Ozone has a pungent odor that allows it to be detected even at very low amounts. Ozone reacts rapidly with many chemical compounds and is explosive in concentrated amounts. Electrical discharges are generally used to produce ozone for industrial processes such as air and water purification and bleaching of textiles and food products.
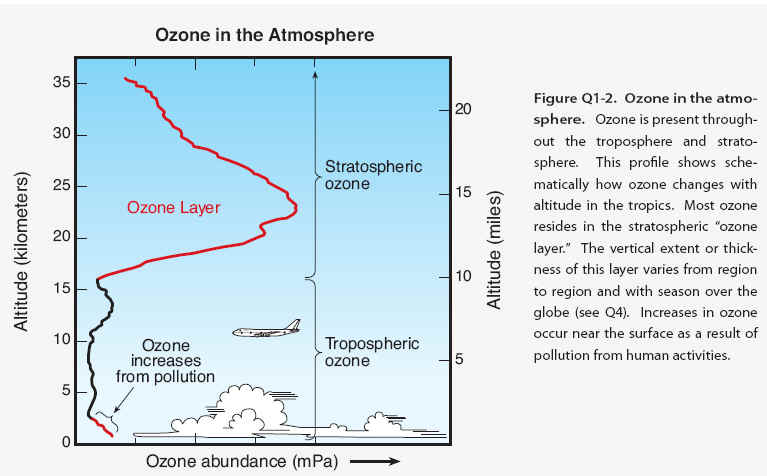
Ozone location. Most ozone (about 90%) is found in the stratosphere, which begins about 10.16 kilometers (6.10 miles) above Earth'fs surface and extends up to about 50 kilometers (31 miles) altitude. The stratospheric region with the highest ozone concentration is commonly known as the . The ozone layer extends over the entire globe with some variation in altitude and thickness. The remaining ozone, about 10%, is found in the troposphere, which is the lowest region of the atmosphere, between Earth's surface and the stratosphere.
Ozone abundance. Ozone molecules have a low relative abundance in the atmosphere. In the stratosphere near the peak concentration of the ozone layer, there are typically a few thousand ozone molecules for every billion air molecules (1 billion = 1,000 million). Most air molecules are either oxygen (O2) or nitrogen (N2) molecules. In the troposphere near Earth's surface, ozone is even less abundant, with a typical range of 20 to 100 ozone molecules for each billion air molecules. The highest surface values result when ozone is formed in air polluted by human activities. As an illustration of the low relative abundance of ozone in our atmosphere, one can imagine bringing all the ozone molecules in the troposphere and stratosphere down to Earth'fs surface and uniformly distributing these molecules into a layer of gas extending over the globe. The resulting layer of pure ozone would have an average thickness of about three millimeters (about one-tenth inch). Nonetheless, this extremely small fraction of the atmosphere plays a vital role in protecting life on Earth.
How is ozone formed in the atmosphere?
Stratospheric ozone-
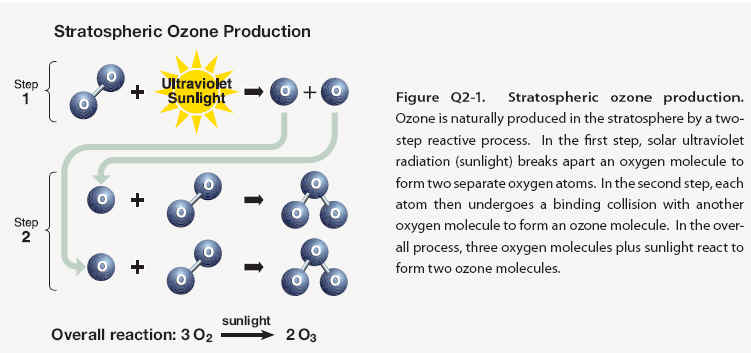
Stratospheric ozone is formed naturally by chemical reactions involving solar ultraviolet radiation (sunlight) and oxygen molecules, which make up 21% of the atmosphere. In the first step, solar ultraviolet radiation breaks apart one oxygen molecule (O2) to produce two oxygen atoms (2 O) (see Figure Q2-1). In the second step, each of these highly reactive atoms combines with an oxygen molecule to produce an ozone molecule (O3). These reactions occur continually whenever solar ultraviolet radiation is present in the stratosphere. As a result, the largest ozone production occurs in the tropical stratosphere. The production of stratospheric ozone is balanced by its destruction in chemical reactions. Ozone reacts continually with sunlight and a wide variety of natural and humanproduced chemicals in the stratosphere. In each reaction, an ozone molecule is lost and other chemical compounds are produced. Important reactive gases that destroy ozone are hydrogen and nitrogen oxides and those containing chlorine and bromine . Some stratospheric ozone is regularly transported down into the troposphere and can occasionally influence ozone amounts at Earth’s surface, particularly in remote, unpolluted regions of the globe.
Tropospheric ozone-
Near Earth’s surface, ozone is produced by chemical reactions involving naturally occurring gases and gases from pollution sources. Ozone production reactions primarily involve hydrocarbon and nitrogen oxide gases, as well as ozone itself, and all require sunlight for completion. Fossil fuel combustion is a primary source of pollutant gases that lead to tropospheric ozone production. The production of ozone near the surface does not significantly contribute to the abundance of stratospheric ozone. The amount of surface ozone is too small in comparison and the transport of surface air to the stratosphere is not effective enough. As in the stratosphere, ozone in the troposphere is destroyed by naturally occurring chemical reactions and by reactions involving human-produced chemicals. Tropospheric ozone can also be destroyed when ozone reacts with a variety of surfaces, such as those of soils and plants.
Balance of chemical processes-
Ozone abundances in the stratosphere and troposphere are determined by the balance between chemical processes that produce and destroy ozone. The balance is determined by the amounts of reactive gases and how the rate or effectiveness of the various reactions varies with sunlight intensity, location in the atmosphere, temperature, and other factors. As atmospheric conditions change to favor ozone-producing reactions in a certain location, ozone abundances increase. Similarly, if conditions change to favor other reactions that destroy ozone, abundances decrease. The balance of production and loss reactions combined with atmospheric air motions determines the global distribution of ozone on timescales of days to many months. Global ozone has decreased during the past several decades because the amounts of reactive gases containing chlorine and bromine have increased in the stratosphere due to human activities.
Ozone abundances in the stratosphere and troposphere are determined by the balance between chemical processes that produce and destroy ozone. The balance is determined by the amounts of reactive gases and how the rate or effectiveness of the various reactions varies with sunlight intensity, location in the atmosphere, temperature, and other factors. As atmospheric conditions change to favor ozone-producing reactions in a certain location, ozone abundances increase. Similarly, if conditions change to favor other reactions that destroy ozone, abundances decrease. The balance of production and loss reactions combined with atmospheric air motions determines the global distribution of ozone on timescales of days to many months. Global ozone has decreased during the past several decades because the amounts of reactive gases containing chlorine and bromine have increased in the stratosphere due to human activities.
Why do we care about atmospheric ozone?
Ozone in the stratosphere absorbs a large part of the Sun’s biologically harmful ultraviolet radiation. Stratospheric ozone is considered “good” ozone because of this beneficial role. In contrast, ozone formed at Earth’s surface in excess of natural amounts is considered “bad” ozone because it is harmful to humans, plants, and animals. Natural ozone near the surface and in the lower atmosphere plays an important beneficial role in chemically removing pollutants from the atmosphere.
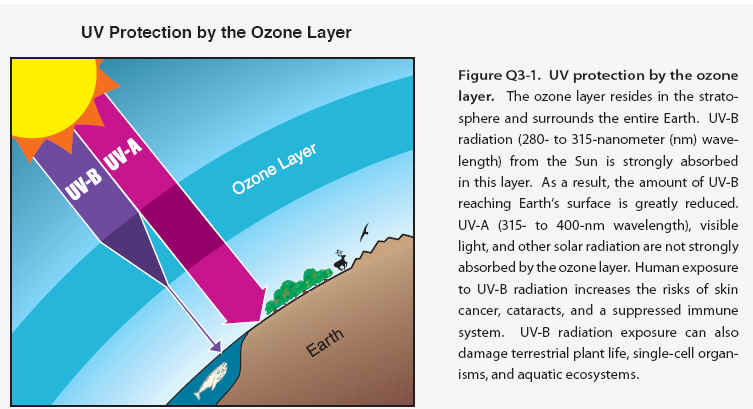
Good ozone- Stratospheric ozone is considered good for humans and other life forms because it absorbs ultraviolet- B (UV-B) radiation from the Sun . If not absorbed, UV-B radiation would reach Earth’s surface in amounts that are harmful to a variety of life forms. In humans, increased exposure to UV-B radiation increases the risks of skin cancer, cataracts, and a suppressed immune system. UV-B radiation exposure before adulthood and cumulative exposure are both important health risk factors. Excessive UV-B exposure also can damage terrestrial plant life, single-cell organisms, and aquatic ecosystems. Other UV radiation, UV-A, which is not absorbed significantly by ozone, causes premature aging of the skin.
Protecting good ozone- In the mid-1970s, it was discovered that gases containing chlorine and bromine atoms released by human activities could cause stratospheric ozone depletion . These gases, referred to as halogen source gases, and as ozone-depleting substances (ODSs), chemically release their chlorine and bromine atoms after they reach the stratosphere. Ozone depletion increases surface UV-B radiation above naturally occurring amounts. International efforts have been successful in protecting the ozone layer through controls on ODS production and consumption.
Bad ozone- Ozone near Earth’s surface in excess of natural amounts is considered bad ozone. It is formed by reactions involving human-made pollutant gases. Increasing surface ozone above natural levels is harmful to humans, plants, and other living systems because ozone reacts strongly to destroy or alter many biological molecules. High ozone exposure reduces crop yields and forest growth. In humans, exposure to high levels of ozone can reduce lung capacity; cause chest pains, throat irritation, and coughing; and worsen preexisting health conditions related to the heart and lungs. In addition, increases in tropospheric ozone lead to a warming of Earth’s surface because ozone is a greenhouse gas. The negative effects of excess tropospheric ozone contrast sharply with the protection from harmful UV-B radiation afforded by an abundance of stratospheric ozone.
Reducing bad ozone- Limiting the emission of certain common pollutants reduces the production of excess ozone in the air surrounding humans, plants, and animals. Natural emissions from the biosphere, mainly from trees, also participate in reactions that produce ozone. Major sources of pollutants include large cities where fossil fuel consumption and industrial activities are greatest. Many programs around the globe have already been successful in reducing or limiting the emission of pollutants that cause production of excess ozone near Earth’s surface.
Natural ozone- In the absence of human activities, ozone would still be present near Earth’s surface and throughout the troposphere and stratosphere because ozone is a natural component of the clean atmosphere. Ozone plays important roles in the atmosphere beyond absorbing UV radiation. For example, ozone initiates the chemical removal of many pollutants, such as carbon monoxide (CO) and nitrogen oxides (NOx), as well as some greenhouse gases, such as methane (CH4). In addition, the absorption of UV-B radiation by ozone is a natural source of heat in the stratosphere, causing temperatures to increase with altitude. Stratospheric temperatures affect the balance of ozone production and destruction processes and air motions that redistribute ozone throughout the stratosphere.
How is total ozone distributed over the globe?
Total ozone. Total ozone at any location on the globe is defined as the sum of all the ozone in the atmosphere directly above that location. Most ozone resides in the stratospheric ozone layer and a small percentage (about 10%) is distributed throughout the troposphere . Total ozone values are often reported in Dobson units denoted as “DU.” Typical values vary between 200 and 500 DU over the globe . The ozone molecules required for total ozone to be 500 DU around the globe, for example, could also form a layer of pure ozone gas at Earth’s surface having a thickness of only 5 millimeters (0.2 inches) .
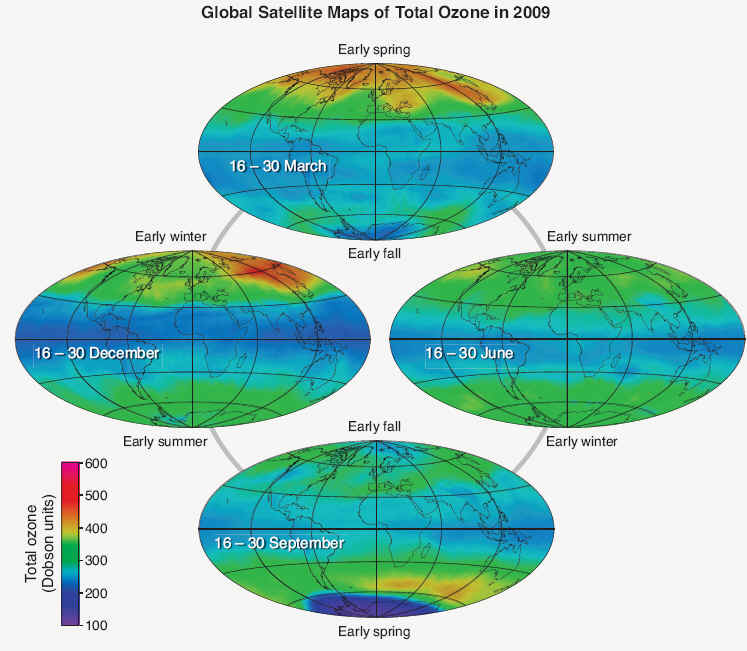
Global distribution- Total ozone varies strongly with latitude over the globe, with the largest values occurring at middle and high latitudes during all seasons . This is the result of ozone production rates from solar ultraviolet radiation that are highest on average in the tropics, and the large-scale air circulation in the stratosphere that slowly transports tropical ozone toward the poles. Ozone accumulates at middle and high latitudes, increasing the thickness (or vertical extent) of the ozone layer and, at the same time, total ozone. In contrast, the values of total ozone are the lowest in the tropics in all seasons (except in the ozone hole) because the thickness of the ozone layer is smallest there.
Seasonal distribution- Total ozone also varies with season, as is shown in Figure Q4-1 using two-week averages of ozone taken from 2009 satellite observations. March and September plots represent the early spring and fall seasons in the Northern and Southern Hemispheres. June and December plots similarly represent the early summer and winter seasons. Total ozone shows a maximum at high latitudes during spring as a result of increased transport of ozone from its source region in the tropics toward the polar regions during late fall and winter. This ozone transport is much weaker during the summer and early fall periods and is weaker overall in the Southern Hemisphere. An important feature of seasonal ozone changes is the natural chemical destruction that occurs when daylight is continuous in the summer polar stratosphere, which causes total ozone to decrease gradually toward its lowest values in early fall. This natural seasonal cycle can be observed clearly in the Northern Hemisphere as shown in Figure Q4-1, with increasing values in Arctic total ozone during winter, a clear maximum in spring, and decreasing values from summer to fall. In the Antarctic, however, a pronounced minimum in total ozone is observed during spring. The minimum is a consequence of the “ozone hole,” which describes the widespread chemical destruction of ozone by ozone-depleting substances in spring. In the late 1970s, before the ozone hole appeared each year, much higher ozone values were found in Antarctic spring . Now, the lowest values of total ozone across the globe and all seasons are found every spring in the Antarctic as shown in Figure Q4-1. After spring, these low values disappear from total ozone maps as polar air mixes with lower-latitude air containing much higher ozone values. In the tropics, the total ozone changes through the spring-summer- fall-winter progression of the seasons are much smaller than in the polar regions. This is because seasonal changes in both sunlight and ozone transport are smaller in the tropics than in the polar regions.
Figure Q4-1. Total ozone. Total ozone at any location on the globe is defined as the sum of all the ozone molecules in the atmosphere directly above that location. Total ozone varies with latitude, longitude, and season, with the largest values at high latitudes and the lowest values in tropical regions. The variations are demonstrated here with two-week averages of total ozone in 2009 as measured with a satellite instrument. Total ozone shows little variation in the tropics (20°N–20°S latitudes) over all seasons. Total ozone outside the tropics varies more strongly with time on a daily to seasonal basis as ozone-rich air is moved from the tropics and accumulates at higher latitudes. The low total ozone values over Antarctica in September constitute the “ozone hole” in 2009. Since the 1980s, the ozone hole in late winter and early spring represents the lowest values of total ozone that occur over all seasons and latitudes
Natural variations- Total ozone varies strongly with latitude and longitude within the seasonal plots in Figure Q4-1. These patterns, which change on daily to weekly timescales, come about for two reasons. First, natural air motions mix and blend air between regions of the stratosphere that have high ozone values and those that have low ozone values. Tropospheric weather systems can temporarily change the thickness of the ozone layer in a region, and thereby change total ozone. The geographical variation in these air motions in turn causes variations in the distribution of total ozone. Second, ozone variations occur as a result of changes in the balance of chemical production and loss processes as air moves to and from different locations over the globe. This balance, for example, is very sensitive to the amount of sunlight in a region. The distribution of total ozone over the Earth varies with location on timescales that range from daily to seasonal. The variations are caused by large-scale movements of stratospheric air and the chemical production and destruction of ozone. Total ozone is generally lowest at the equator and highest in polar regions.
How is ozone measured in the atmosphere?
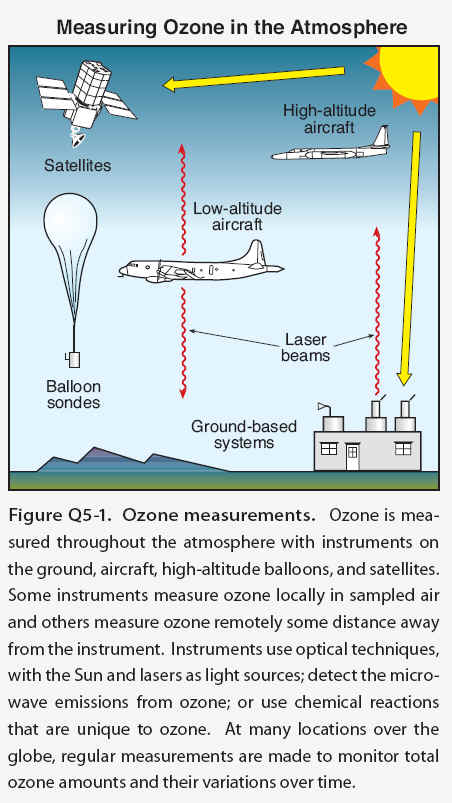
The amount of ozone in the atmosphere is measured by instruments on the ground and carried aloft on balloons, aircraft, and satellites. Some instruments measure ozone locally by continuously drawing air samples into a small detection chamber. Other instruments measure ozone remotely over long distances by using ozone’s unique optical absorption or emission properties.
The abundance of ozone in the atmosphere is measured by a variety of techniques . The techniques make use of ozone’s unique optical and chemical properties. There are two principal categories of measurement techniques: local and remote. Ozone measurements by these techniques have been essential in monitoring changes in the ozone layer and in developing our understanding of the processes that control ozone abundances.
Local measurements- Local measurements of atmospheric ozone abundance are those that require air to be drawn directly into an instrument. Once inside an instrument’s detection chamber, ozone is measured by its absorption of ultraviolet (UV) light or by the electrical current or light produced in a chemical reaction involving ozone. The last approach is used in the construction of “ozonesondes,” which are lightweight, ozone-measuring modules suitable for launching on small balloons. The balloons ascend far enough in the atmosphere to measure ozone in the stratospheric ozone layer. Ozonesondes are launched regularly at many locations around the world. Local ozone-measuring instruments using optical or chemical detection schemes are also used routinely on research aircraft to measure the distribution of ozone in the troposphere and lower stratosphere. High-altitude research aircraft can reach the ozone layer at most locations over the globe and can reach farthest into the layer at high latitudes. Ozone measurements are also being made routinely on some commercial aircraft flights.
Remote measurements- Remote measurements of total ozone amounts and the altitude distributions of ozone are obtained by detecting ozone at large distances from the instrument. Most remote measurements of ozone rely on its unique absorption of UV radiation. Sources of UV radiation that can be used are the Sun, lasers, and starlight. For example, satellites use the absorption of solar UV radiation by the atmosphere or the absorption of sunlight scattered from the surface of Earth to measure ozone over nearly the entire globe on a daily basis. Lasers are routinely deployed at ground sites and on research aircraft to detect ozone over a distance of many kilometers along the laser light path. A network of ground-based detectors measures ozone by detecting small changes in the amount of the Sun’s UV radiation that reaches Earth’s surface. Other instruments measure ozone using its absorption of infrared or visible radiation or its emission ofmicrowave or infrared radiation. Emission measurements have the advantage of providing remote ozone measurements at night, which is particularly valuable for sampling polar regions in continuous darkness.
Global Ozone Network
The first instrument for routinely monitoring total ozone was developed by Gordon M.B. Dobson in the United Kingdom in the 1920s. The instrument, called a Féry spectrometer, made its measurements by examining the wavelength spectrum of solar ultraviolet radiation (sunlight) using a photographic plate. A small network of instruments distributed around Europe allowed Dobson to make important discoveries about how total ozone varies with location and time. In the 1930s a new instrument was developed by Dobson, now called a Dobson spectrophotometer, which precisely measures the intensity of sunlight at two ultraviolet wavelengths: one that is strongly absorbed by ozone and one that is weakly absorbed. The difference in light intensity at the two wavelengths provides a measure of total ozone above the instrument location. A global network of total-ozone observing stations was established in 1957 as part of the International Geophysical Year. Today, there are about 100 sites located around the world ranging from South Pole, Antarctica (90°S), to Ellesmere Island, Canada (83°N), that routinely measure total ozone. The accuracy of these observations is maintained by regular instrument calibrations and intercomparisons. Data from the network have been essential for understanding the effects of chlorofluorocarbons (CFCs) and other ozone-depleting substances on the global ozone layer, starting before the launch of space-based ozone-measuring instruments and continuing to the present day. Ground-based instruments with excellent long-term stability and accuracy are now routinely used to help calibrate space-based observations of total ozone. Pioneering scientists have traditionally been honored by having units of measure named after them. Accordingly, the unit of measure for total ozone is called the “Dobson unit”
What are the principal steps in stratospheric ozone depletion caused by human activities?
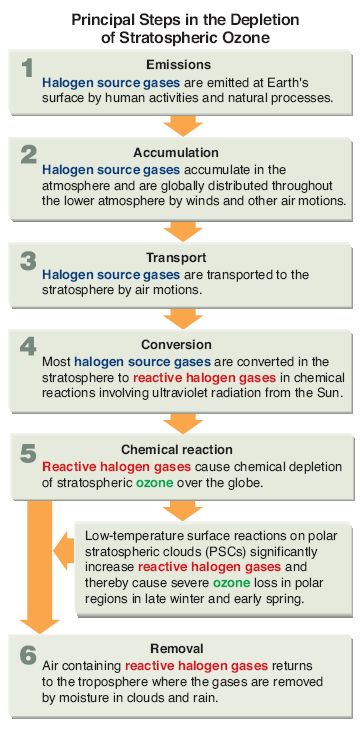
The initial step in the depletion of stratospheric ozone by human activities is the emission, at Earth’s surface, of gases containing chlorine and bromine. Most of these gases accumulate in the lower atmosphere because they are unreactive and do not dissolve readily in rain or snow. Natural air motions transport these accumulated gases to the stratosphere, where they are converted to more reactive gases. Some of these gases then participate in reactions that destroy ozone. Finally, when air returns to the lower atmosphere, these reactive chlorine and bromine gases are removed from Earth’s atmosphere by rain and snow.
Emission, accumulation, and transport. The principal steps in stratospheric ozone depletion caused by human activities are shown in Figure Q6-1. The process begins with the emission, at Earth’s surface, of source gases containing the halogens chlorine and bromine (see Q7). The halogen source gases, often referred to as ozone-depleting substances (ODSs), include manufactured chemicals released to the atmosphere in a variety of applications, such as refrigeration, air conditioning, and foam blowing. Chlorofluorocarbons (CFCs) are an important example of chlorine-containing gases. Emitted source gases accumulate in the lower atmosphere (troposphere) and are transported to the stratosphere by natural air motions. The accumulation occurs because most source gases are highly unreactive in the lower atmosphere. Small amounts of these gases dissolve in ocean waters. The low reactivity of these manufactured halogenated gases is one property that makes them well suited for specialized applications such as refrigeration. Some halogen gases are emitted in substantial quantities from natural sources (see Q7). These emissions also accumulate in the troposphere, are transported to the stratosphere, and participate in ozone destruction reactions. These naturally emitted gases are part of the natural balance of ozone production and destruction that predates the large release of manufactured halogenated gases.
Figure Q6-1. Principal steps in stratospheric ozone depletion. The stratospheric ozone depletion process begins with the emission of halogen source gases by human activities and natural processes. Those emitted by human activities are also called ozone-depleting substances (ODSs). Subsequent steps are accumulation, transport, conversion, chemical reaction, and removal. Ozone depletion by halogen source gases occurs globally. Large seasonal ozone losses occur in polar regions as a result of reactions involving polar stratospheric clouds (PSCs). Ozone depletion ends when reactive halogen gases are removed by rain and snow in the troposphere and deposited on Earth’s surface.
Conversion, reaction, and removal. Halogen source gases do not react directly with ozone. Once in the stratosphere, halogen source gases are chemically converted to reactive halogen gases by ultraviolet radiation from the Sun . The rate of conversion is related to the atmospheric lifetime of a gas. Gases with longer lifetimes have slower conversion rates and survive longer in the atmosphere after emission. Lifetimes of the principal ODSs vary from 1 to 100 years . Emitted gas molecules with atmospheric lifetimes greater than a few years circulate between the troposphere and stratosphere multiple times, on average, before conversion occurs. The reactive gases formed from halogen source gases react chemically to destroy ozone in the stratosphere . The average depletion of total ozone attributed to reactive gases is smallest in the tropics and largest at high latitudes . In polar regions, surface reactions that occur at low temperatures on polar stratospheric clouds (PSCs) greatly increase the abundance of the most reactive chlorine gas, chlorine monoxide (ClO) (see Q10). This results in substantial ozone destruction in polar regions in late winter and early spring . After a few years, air in the stratosphere returns to the troposphere, bringing along reactive halogen gases. These gases are then removed from the atmosphere by rain and other precipitation or deposited on Earth’s land or ocean surfaces. This removal brings to an end the destruction of ozone by chlorine and bromine atoms that were first released to the atmosphere as components of halogen source gas molecules. Tropospheric conversion. Halogen source gases with short lifetimes (less than 1 year) undergo significant chemical conversion in the troposphere, producing reactive halogen gases and other compounds. Source gas molecules that are not converted are transported to the stratosphere. Only small portions of reactive halogen gases produced in the troposphere are transported to the stratosphere because most are removed by precipitation. Important examples of halogen gases that undergo some tropospheric removal are the hydrochlorofluorocarbons (HCFCs), methyl bromide (CH3Br), and gases containing iodine .
Credit:Scientific Assessment of Ozone Depletion: 2010-Coordinating Lead Authors: David W. Fahey Michaela I. Hegglin-The update of this component of the Assessment was discussed by the 74 scientists who attended the Panel Review Meeting for the 2010 Ozone Assessment (Les Diablerets, Switzerland, 28 June–2 July 2010). In addition, subsequent contributions, reviews, or comments were provided by the following individuals: Ross J. Salawitch (Special Recognition), Stephen A. Montzka (Special Recognition), Stephen O. Andersen (Special Recognition), Pieter J. Aucamp, Alkiviadis F. Bais, Peter F. Bernath, Gregory E. Bodeker, Janet F. Bornman, Geir O. Braathen, Peter Braesicke, Irene Cionni, Martin Dameris, John S. Daniel, Susana B. Diaz, Ellsworth G. Dutton, James W. Elkins, Christine A. Ennis, Veronika Eyring, Vitali E. Fioletov, Marvin A. Geller, Sophie Godin-Beekmann, Malcolm K.W. Ko, Kirstin Krüger, Lambert Kuijpers, Michael J. Kurylo, Igor Larin, Gloria L. Manney, C. Thomas McElroy, Rolf Müller, Eric R. Nash, Paul A. Newman, Samuel J. Oltmans, Nigel D. Paul, Judith Perlwitz, Jean-Pierre Pommereau, Claire E. Reeves, Stefan Reimann, Alan Robock, Michelle L. Santee, Dian J. Seidel, Theodore G. Shepherd, Peter Simmonds, Anne K. Smith, Richard S. Stolarski, Matthew B. Tully, Guus J.M. Velders, Elizabeth C. Weatherhead, Ann R. Webb, Ray F. Weiss, and Durwood Zaelke. |