|
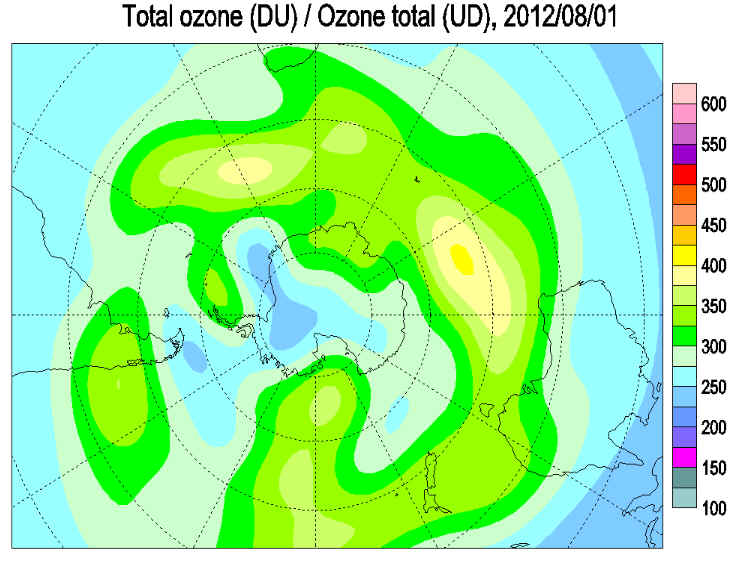
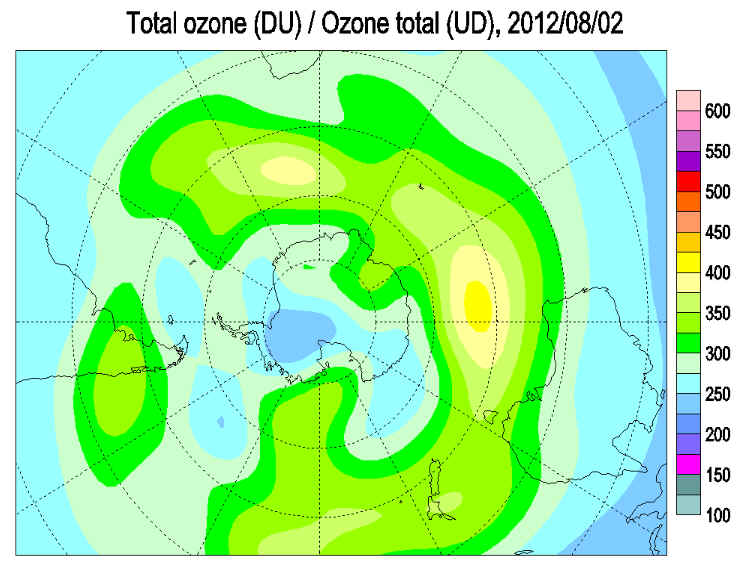
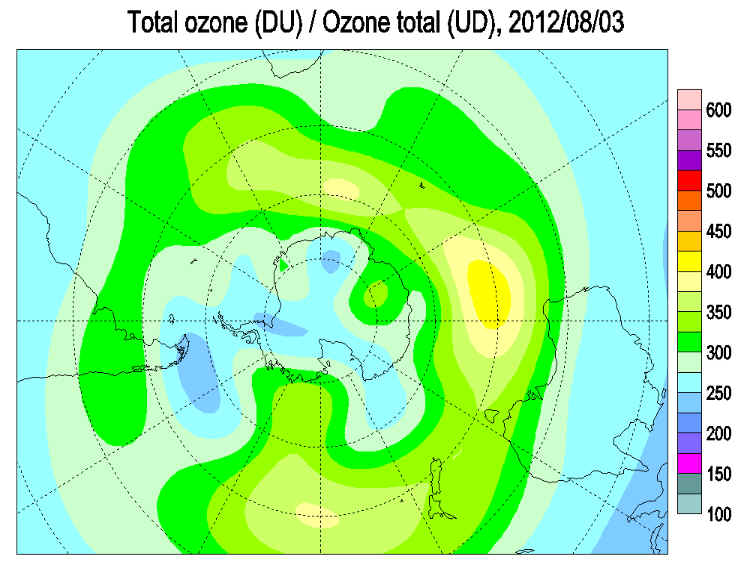
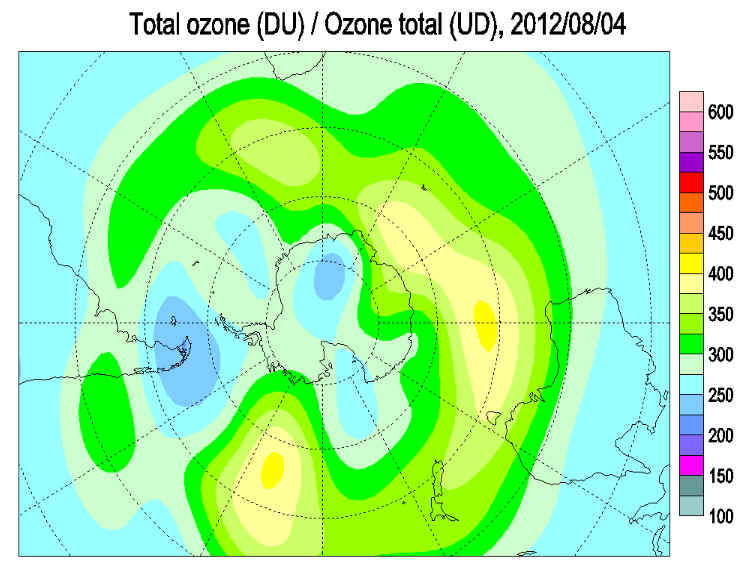
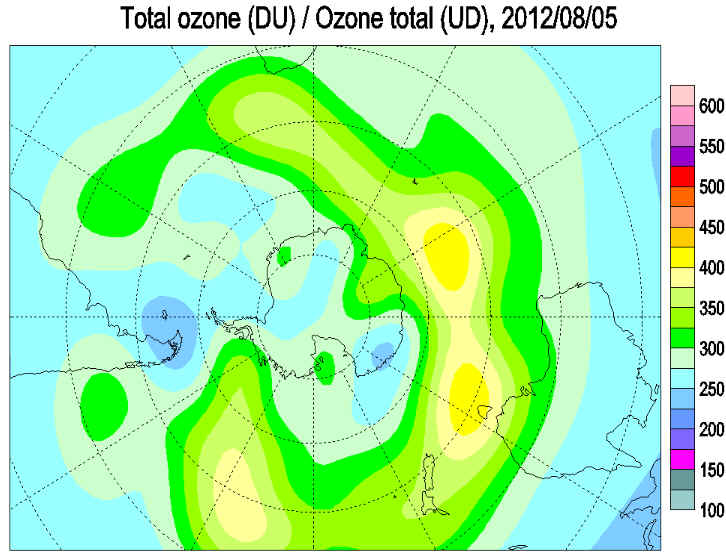
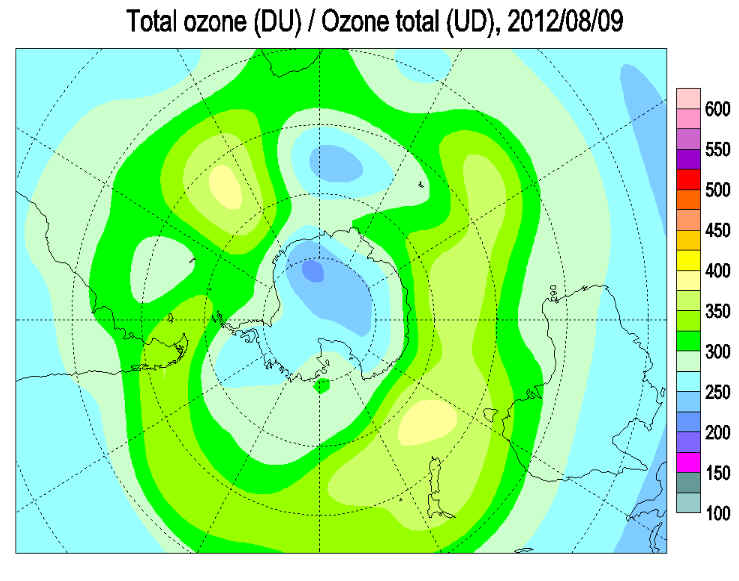
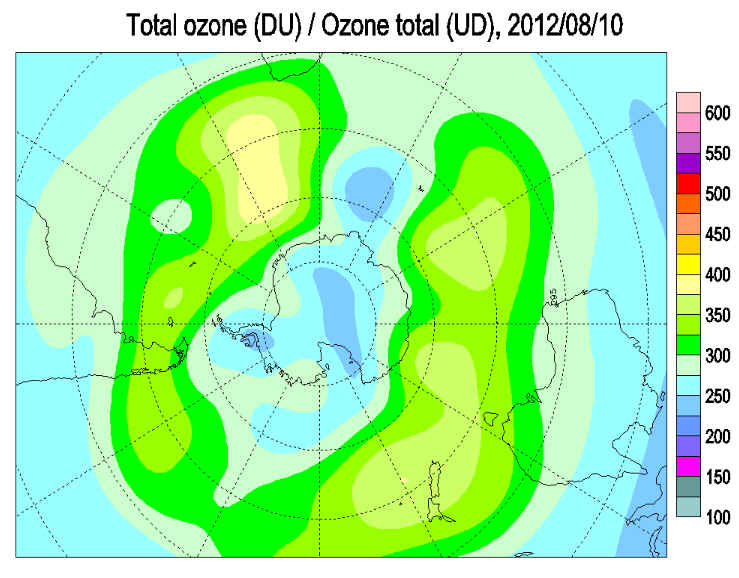
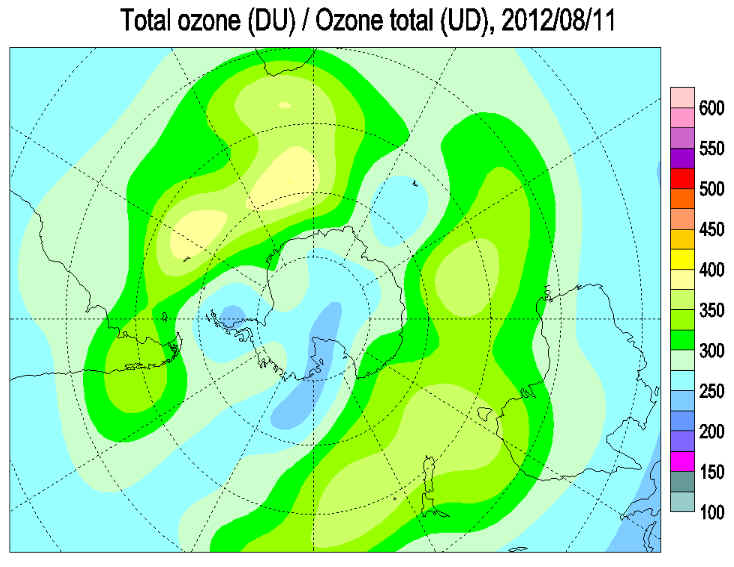
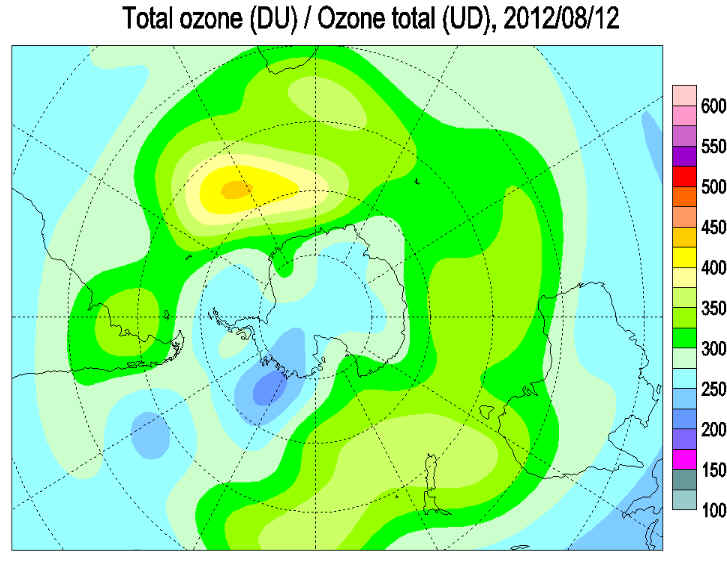
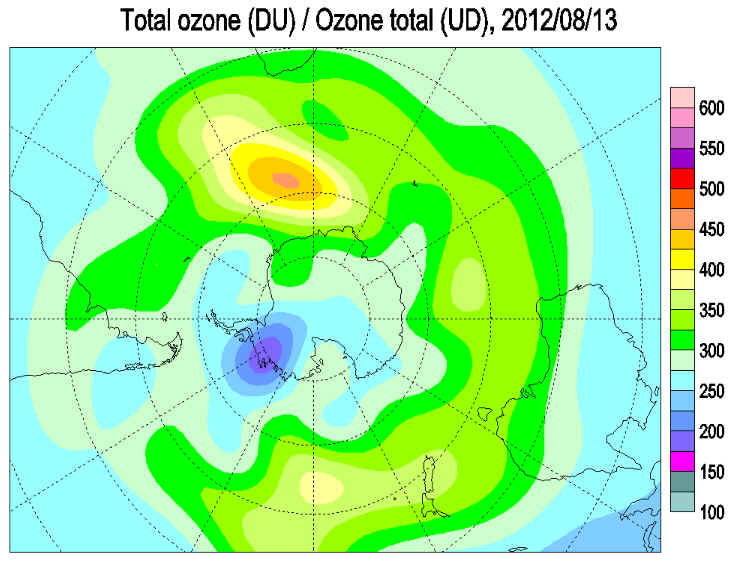
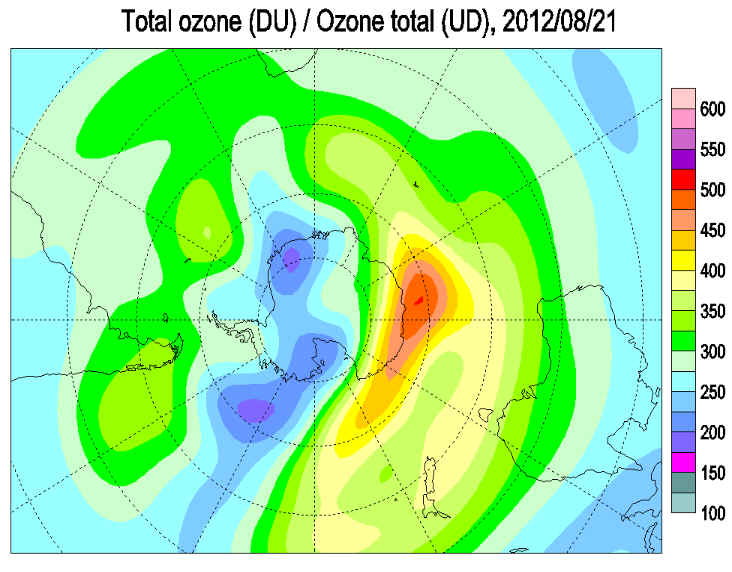
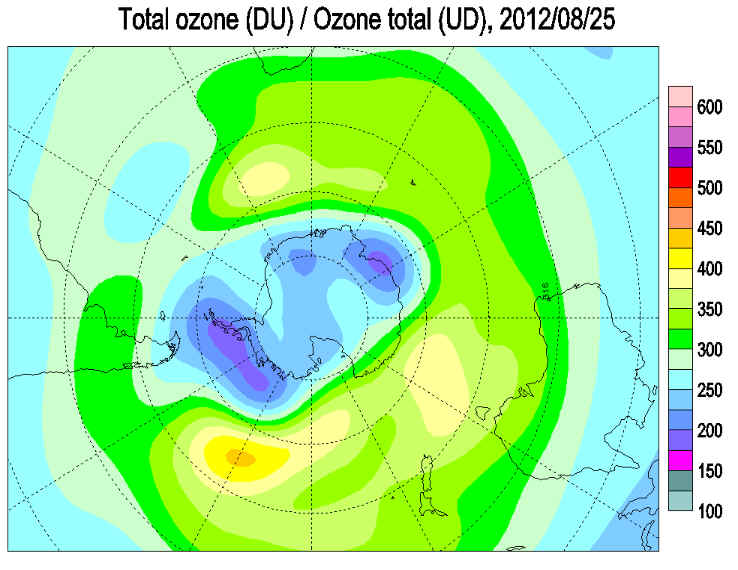
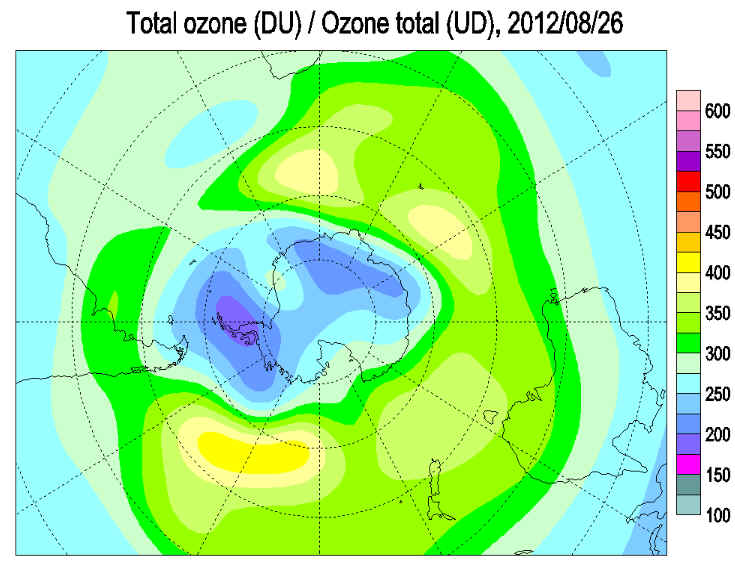
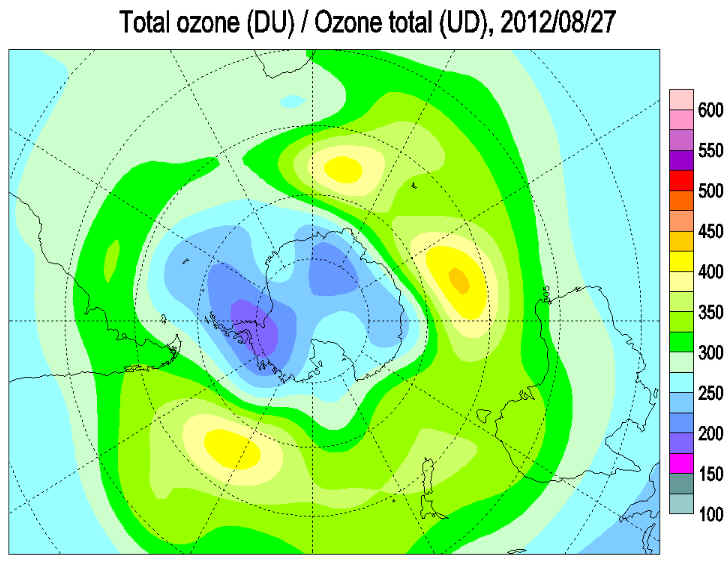
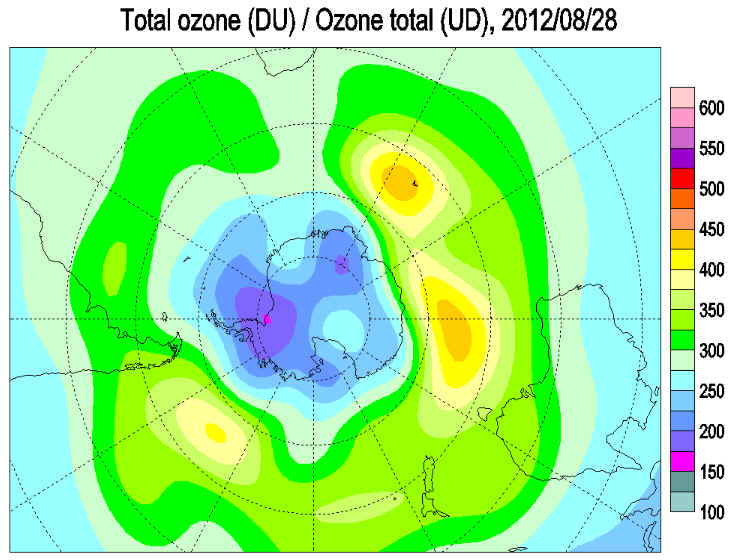
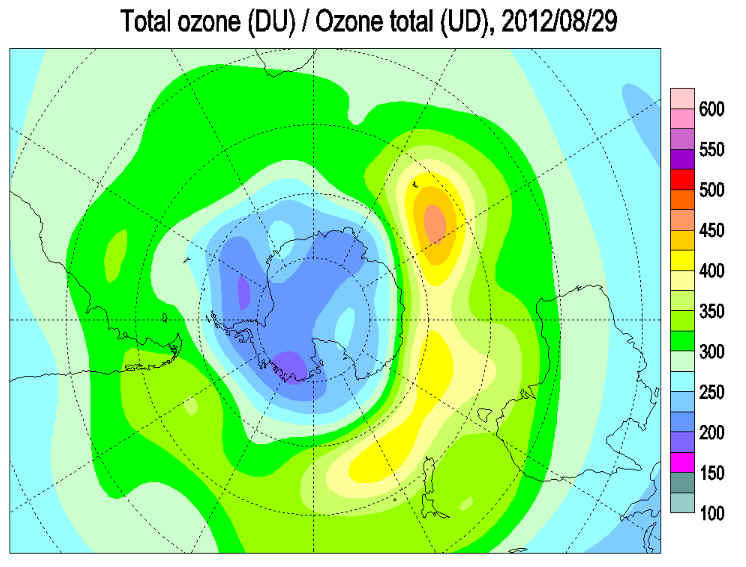
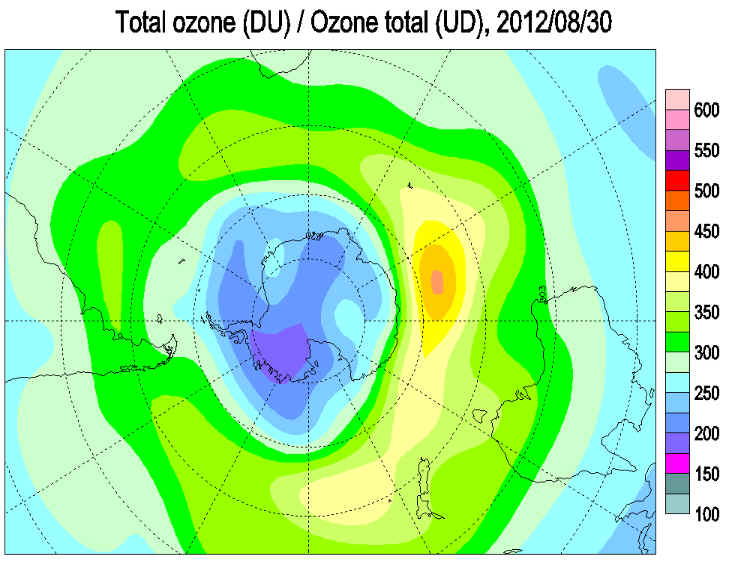
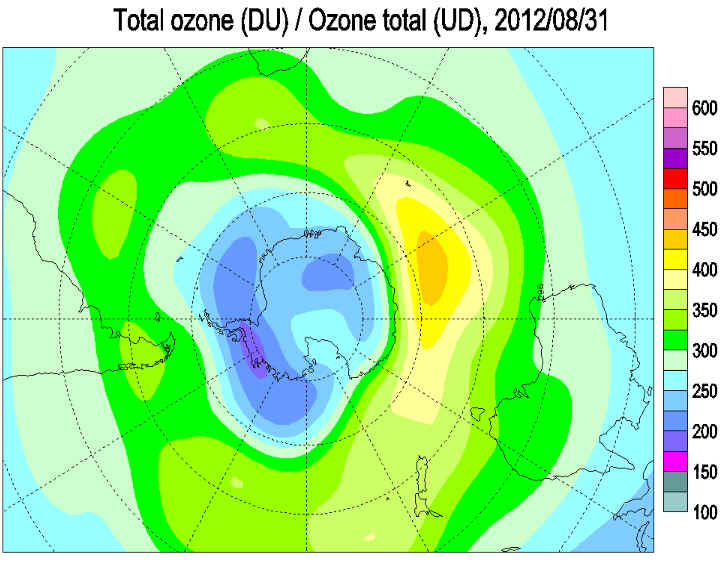
The Ozone Hole August 2012
|
|
The Ozone Hole August 2012
|
|
Data compiled from The British Antarctic Study, NASA, NASA Ozone Watch, Environment Canada, UNEP, EPA and other sources as stated and credited Updated Daily-Researched By Charles Welch- This Website is a project of the The Ozone Hole Inc. Would you please consider making a donation The Ozone Hole Inc. is a 501c3 nonprofit organization dedicated to protecting the ozone layer, the climate and Earth's environment by educating and motivating the public through its internationally respected websites, http://www.theozonehole.org and http://www.earthlyissues.com . Visit our other websites
Copyright Charles Welch The Ozone Hole |